Hi to all,


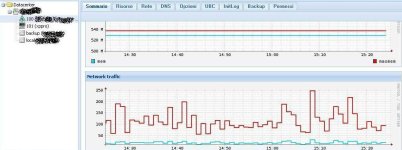
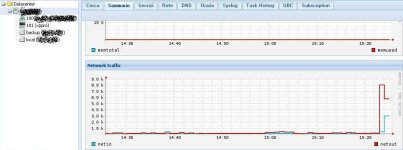
As you can see from the graphs that I am attaching here, while the container shows an outbound traffic that fluctuates between 100 and 250 KBytes / s, the graph of the node, however, shows that there is no network activity (the peak maximum is 9 KBytes / s, probably caused by the opening of the java server Proxmox interface).
How do you explain this behavior? The node should not show the amount of network traffic generated by the Virtual Machine + Containers+Java Server Proxmox interface?
Do you think that my container is actually generating all that traffic (which would mean that I am the victim of a DDoS attack?) or the correct graph is the wich one that is showing no network activity?
Thank you all for your cooperation (sorry for my bad english)
Last edited:

