Script for monitor ZFS Usage

Dexter23

Active Member
Dec 23, 2021
213
15
38
35
Hi everyone
I build this bash script for monitor zfs pool and receive an email when the occupied space is more or equal then 80%.
This is the script:
Code:
#!/bin/bash
# Managed by Ansible
THRESHOLD=80
EMAIL="proxmox@mydomain.tld"
HOSTNAME=$(hostname)

# Fetch ZFS pool data: Name and Capacity (percentage)
zpool list -H -o name,cap | while read -r NAME CAP; do
    # Remove the % symbol for numerical comparison
    USAGE=${CAP%\%}

    if [ "$USAGE" -ge "$THRESHOLD" ]; then
        SUBJECT="ZFS Alert: Pool '$NAME' usage at $USAGE% on $HOSTNAME"
        BODY="WARNING: ZFS pool '$NAME' on server $HOSTNAME has reached $USAGE% capacity.

Threshold set to: $THRESHOLD%
Recommended action: Free up space or add more disks to the pool soon."

        echo "$BODY" | mail -s "$SUBJECT" "$EMAIL"
    fi
done
As you can see the command retrive the % space occupied by the zfs pool:
1770131152474.png
But in the WebUI is not correspoding:
1770131193836.png
How the WebUI showme 82.71% instead of the 44%?
Thanks.
 
mhmm to find that out, could you please post the output of

Code:
zpool list
zfs list
cat /etc/pve/storage.cfg
Code:
root@pve01:~# zpool list
NAME      SIZE  ALLOC   FREE  CKPOINT  EXPANDSZ   FRAG    CAP  DEDUP    HEALTH  ALTROOT
rpool     428G  8.81G   419G        -         -    14%     2%  1.00x    ONLINE  -
zpool01   888G   331G   557G        -         -    51%    37%  1.00x    ONLINE  -
root@pve01:~# zfs list
NAME                    USED  AVAIL  REFER  MOUNTPOINT
rpool                  8.81G   406G    96K  /rpool
rpool/ROOT             8.75G   406G    96K  /rpool/ROOT
rpool/ROOT/pve-1       8.75G   406G  8.75G  /
rpool/data               96K   406G    96K  /rpool/data
zpool01                 712G   149G    96K  /zpool01
zpool01/vm-101-disk-0   712G   529G   331G  -


Code:
root@pve01:~# cat /etc/pve/storage.cfg

dir: local
        path /var/lib/vz
        content iso,vztmpl,backup

zfspool: local-zfs
        pool rpool/data
        content images,rootdir
        sparse 1

zfspool: zpool01
        pool zpool01
        content images,rootdir
        mountpoint /zpool01
        nodes pve01

pbs: pbs01
        datastore customer01
        server pbs01.mydomain.tld
        content backup
        prune-backups keep-all=1
        username customer@pbs

pbs: pbs02-local
        datastore datastore01
        server 192.168.1.22
        content backup
        fingerprint
        xxxxxxxxxxxxxxxxxxxxxxxxxxxxxxxxxxxxxxxxxxxxxxxxxxxxxxxxxxxxxxxxxxxxxxxxxxxxxxxxxxxxxxxxxxxxxxx
        prune-backups keep-all=1
        username root@pam
 
so we take the info from 'zfs list' which shows:

zpool01 712G 149G
which shows ~82% used (USED/(USED+AVAIL))

ok, one additional command output would be helpful to see the geometry of the zpool (which might explain the big difference in output)
Code:
zpool status
 
so we take the info from 'zfs list' which shows:


which shows ~82% used (USED/(USED+AVAIL))

ok, one additional command output would be helpful to see the geometry of the zpool (which might explain the big difference in output)
Code:
zpool status
Code:
root@pve01:~# zpool status
  pool: rpool
 state: ONLINE
status: Some supported and requested features are not enabled on the pool.
        The pool can still be used, but some features are unavailable.
action: Enable all features using 'zpool upgrade'. Once this is done,
        the pool may no longer be accessible by software that does not support
        the features. See zpool-features(7) for details.
  scan: scrub repaired 0B in 00:00:28 with 0 errors on Sun Jan 11 00:24:29 2026
config:

        NAME                                                  STATE     READ WRITE CKSUM
        rpool                                                 ONLINE       0     0     0
          mirror-0                                            ONLINE       0     0     0
            ata-Micron_5400_MTFDDAK480TGA_22383BA91D47-part3  ONLINE       0     0     0
            ata-Micron_5400_MTFDDAK480TGA_22383BA91DB8-part3  ONLINE       0     0     0

errors: No known data errors

  pool: zpool01
 state: ONLINE
status: Some supported and requested features are not enabled on the pool.
        The pool can still be used, but some features are unavailable.
action: Enable all features using 'zpool upgrade'. Once this is done,
        the pool may no longer be accessible by software that does not support
        the features. See zpool-features(7) for details.
  scan: scrub repaired 0B in 00:27:57 with 0 errors on Sun Jan 11 00:51:59 2026
config:

        NAME                                            STATE     READ WRITE CKSUM
        zpool01                                         ONLINE       0     0     0
          mirror-0                                      ONLINE       0     0     0
            ata-Micron_5400_MTFDDAK960TGA_22513D4C6D3F  ONLINE       0     0     0
            ata-Micron_5400_MTFDDAK960TGA_22513D4C7166  ONLINE       0     0     0

errors: No known data errors
 
ah ok sorry, the output wasn't actually necessary to see the issue^^

when you look at your config, you can see that the zpool01 entry does not have the 'sparse 1' option, so the space for each vm volume is reserved upfront:

zpool01/vm-101-disk-0 712G 529G 331G -

so while the vm disk reserves the space from the point of view of 'zfs list' it isn't actually full yet, so the ALLOC (allocated) blocks on the pool is not that big

since we want to know the 'logical' used percentage from the zfs pool, we use what zfs list is giving us

you can turn on 'sparse' in the zfspool storage options, but it won't make the already existing volumes sparse
 
yes, you simply have to use the output of zfs list instead of zpool list
 
This is the script:

Code:
#!/bin/bash
# Managed by Ansible
THRESHOLD=80
EMAIL="proxmox@mydomain.tld"
HOSTNAME=$(hostname)

# 1. Get the names of all existing ZFS pools
POOLS=$(zpool list -H -o name)

for POOL in $POOLS; do
    # 2. Extract USED and AVAIL in bytes (-p) for calculation precision
    READING=$(zfs list -H -p -o used,available "$POOL")
    
    USED=$(echo "$READING" | awk '{print $1}')
    AVAIL=$(echo "$READING" | awk '{print $2}')
    
    # 3. Calculate logical percentage: (USED / (USED + AVAIL)) * 100
    TOTAL=$((USED + AVAIL))
    
    if [ "$TOTAL" -gt 0 ]; then
        USAGE=$(( 100 * USED / TOTAL ))
    else
        USAGE=0
    fi

    # 4. Compare with threshold
    if [ "$USAGE" -ge "$THRESHOLD" ]; then
        SUBJECT="ZFS Alert: Pool '$POOL' usage at $USAGE% on $HOSTNAME"
        
        # Fetch human-readable values for the email body
        USED_HUMAN=$(zfs list -H -o used "$POOL")
        AVAIL_HUMAN=$(zfs list -H -o avail "$POOL")

        BODY="WARNING: ZFS pool '$POOL' on server $HOSTNAME has reached $USAGE% capacity.

Details:
Used Space (Logical): $USED_HUMAN
Available Space: $AVAIL_HUMAN
Threshold set to: $THRESHOLD%

Recommended action: Check Proxmox snapshots or VM disk allocations."

        echo "$BODY" | mail -s "$SUBJECT" "$EMAIL"
    fi
done
 
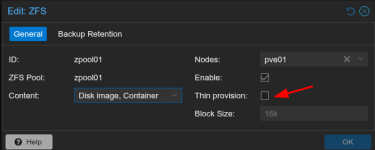
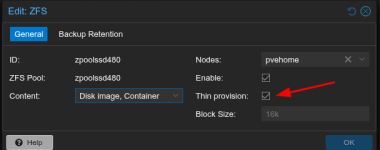
So if i uderstand correctly, the option "sparse 1" is when this checkbox is checked?
1770208228641.png
But if i selected the existing file of vm disk is not reduce the allocated space right?So it doesn't make any changes if i enable this option after?
 
So if i understand correctly if i do this command:
Code:
zfs list -H -oname,refreservation | grep -Ev "none" | awk '/vm-/ {print $1'} | while read disk; do echo "zfs set refreservation=none $disk"; done
In theory if that vm space occupied is for example 500gb but the size disk of the VM is 700GB the usage space is reduce until 500gb?i'm right?
 
This command just prints commands for you (echo). Why not try it out for one dataset? It's easy to revert. Thin provisioning is enabled by default for ZFS installs.
 
Last edited:
Anyway i modify the script using the command "pvesm status"
Code:
#!/bin/bash
THRESHOLD=80
EMAIL="proxmox@mydomain.tld"
HOSTNAME=$(hostname)

pvesm status | grep "active" | tr -d '%' | awk -v limit="$THRESHOLD" '$7 >= limit {print $1, $2, $7}' | while read -r NAME TYPE USAGE; do

SUBJECT="Storage Alert: '$NAME' ($TYPE) at $USAGE% on $HOSTNAME"
BODY="WARNING: Storage '$NAME' (Type: $TYPE) on server $HOSTNAME has reached $USAGE% capacity.

Details:
Storage Name: $NAME
Storage Type: $TYPE
Current Usage: $USAGE%
Threshold: $THRESHOLD%

Recommended action: Free up space, delete old snapshots/backups, or add capacity soon."

echo "$BODY" | mail -s "$SUBJECT" "$EMAIL"
done

This command just prints commands for you (echo). Why not try it out for one dataset? It's easy to revert. Thin provisioning is enabled by default for ZFS installs.
Later i try with one zfs pool that already have a vm disk
 
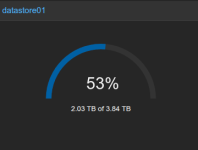
I see that the command "pvesm" on Proxmox Backup Server is there a equivalent command to retrive this usage%? As the WebUI Shows:
1770211860958.png
UPDATE: Really i don't need to make a script also for PBS because on PVE has already the PBS Storage for space monitor.
 
Last edited:
Why not follow what I told you above? There is no need to clone or recreate things.
 
Last edited:
  • Like
Reactions: flames