Hi All,
I'm completely new to Proxmox. I built a budget homelab with scavenged parts which include the following components:
256 GB Registered Micron Memory (32x8) @2133MT/s (purchased used)
2x 18core Xeon e5-2696 v3 Processors (purchased used)
Machinist D8 Max X99 2011-3 motherboard (new off Ebay)
2x 2TB NVMe
1x 500GB NVMe (using a PCIe adapter)
1x 8TB Seagate NAS drive
3x 12TB Seagate NAS drives
NVidia GT730 low profile GPU
NVidia GTX 1660 Ti
Using the latest version of Proxmox at the time of writing: 8.0.4
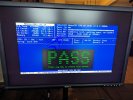
All memory passed after a single pass using the memtest tool included in the Proxmox install ISO.
Since the motherboard doesn't have onboard video, I reserved the low profile GT730 for the PVE host, so I didn't blacklist 'nvidia' in /etc/modprobe.d/blacklist.conf. Perhaps there's a better way to isolate the GPUs that I'm unaware of.
Successfully installed Win Server 2022, turned Ballooning off as this is the VM I'm using to passthrough. The VM seems stable - everything works fine, running for two days without issue and verified the GTX 1660 Ti is transcoding videos just fine; however, I'm getting a sh*t-ton of rasdaemon errors. This occurs at least 35 times every 2-4 minutes based on what I'm seeing in the syslog. Note: This only occurs when the VM I'm using for passthrough is turned-on.
From PVE -> syslog
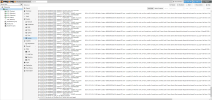
Here's a snapshot of the syslog in the web gui to give you some perspective.
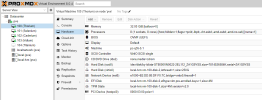
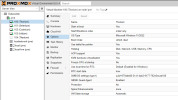
I have passthrough configured as follows:
/etc/default/grub
/etc/modules
Below are results of lspci for the GTX 1660 Ti I'm using for passthrough:
/etc/modprobe.d/vfio.conf
I hope I provided enough information. I mean, like I said, the VM itself seems to be running just fine, but I'm worried about all of the errors exponentially filling the journal.
I'm hoping someone out there can identify what I'm doing wrong. Thanks!!
(Edit: Added snapshot of syslog from web gui)
I'm completely new to Proxmox. I built a budget homelab with scavenged parts which include the following components:
256 GB Registered Micron Memory (32x8) @2133MT/s (purchased used)
2x 18core Xeon e5-2696 v3 Processors (purchased used)
Machinist D8 Max X99 2011-3 motherboard (new off Ebay)
2x 2TB NVMe
1x 500GB NVMe (using a PCIe adapter)
1x 8TB Seagate NAS drive
3x 12TB Seagate NAS drives
NVidia GT730 low profile GPU
NVidia GTX 1660 Ti
Using the latest version of Proxmox at the time of writing: 8.0.4
All memory passed after a single pass using the memtest tool included in the Proxmox install ISO.

Since the motherboard doesn't have onboard video, I reserved the low profile GT730 for the PVE host, so I didn't blacklist 'nvidia' in /etc/modprobe.d/blacklist.conf. Perhaps there's a better way to isolate the GPUs that I'm unaware of.
Successfully installed Win Server 2022, turned Ballooning off as this is the VM I'm using to passthrough. The VM seems stable - everything works fine, running for two days without issue and verified the GTX 1660 Ti is transcoding videos just fine; however, I'm getting a sh*t-ton of rasdaemon errors. This occurs at least 35 times every 2-4 minutes based on what I'm seeing in the syslog. Note: This only occurs when the VM I'm using for passthrough is turned-on.
From PVE -> syslog
Code:
Nov 03 14:53:02 pve rasdaemon[1518]:            <...>-278270 [000]     0.015316: mce_record:           2023-11-03 12:11:03 -0500 bank=5, status= c80000c000310e0f, Rx detected CRC error - successful LLR wihout Phy re-init, mci=Error_overflow Corrected_error, mca=BUS Level-3 Generic Generic Other-transaction Request-did-not-timeout Error, cpu_type= Intel Xeon v3 (Haswell) EP/EX, cpu= 0, socketid= 0, misc= 1dd87b000d9eff, mcgstatus=0, mcgcap= 7000c16, apicid= 0
Nov 03 14:53:02 pve rasdaemon[1518]: rasdaemon: mce_record store: 0x55788c8c0868
Nov 03 14:53:02 pve rasdaemon[1518]: rasdaemon: register inserted at db
Nov 03 14:53:02 pve rasdaemon[1518]:            <...>-278270 [000]     0.015316: mce_record:           2023-11-03 12:11:04 -0500 bank=5, status= 8800004000310e0f, Rx detected CRC error - successful LLR wihout Phy re-init, mci=Corrected_error, mca=BUS Level-3 Generic Generic Other-transaction Request-did-not-timeout Error, cpu_type= Intel Xeon v3 (Haswell) EP/EX, cpu= 0, socketid= 0, misc= 1df87b000d9eff, mcgstatus=0, mcgcap= 7000c16, apicid= 0
Nov 03 14:53:02 pve rasdaemon[1518]: rasdaemon: mce_record store: 0x55788c8c0868
Nov 03 14:53:02 pve rasdaemon[1518]: rasdaemon: register inserted at db
Nov 03 14:53:48 pve kernel: mce: [Hardware Error]: Machine check events logged
Nov 03 14:53:50 pve kernel: mce: [Hardware Error]: Machine check events logged
Nov 03 14:53:54 pve rasdaemon[1518]: rasdaemon: mce_record store: 0x55788c8c0868
Nov 03 15:42:08 pve kernel: mce_notify_irq: 29 callbacks suppressed
Here's a snapshot of the syslog in the web gui to give you some perspective.

I have passthrough configured as follows:
/etc/default/grub
Code:
# If you change this file, run 'update-grub' afterwards to update
# /boot/grub/grub.cfg.
# For full documentation of the options in this file, see:
#   info -f grub -n 'Simple configuration'

GRUB_DEFAULT=0
GRUB_TIMEOUT=5
GRUB_DISTRIBUTOR=`lsb_release -i -s 2> /dev/null || echo Debian`
GRUB_CMDLINE_LINUX_DEFAULT="quiet intel_iommu=on video=efifb:off"
GRUB_CMDLINE_LINUX=""

# Everything else is commented out...
/etc/modules
Code:
# /etc/modules: kernel modules to load at boot time.
#
# This file contains the names of kernel modules that should be loaded
# at boot time, one per line. Lines beginning with "#" are ignored.
# Parameters can be specified after the module name.

vfio
vfio_iommu_type1
vfio_pci
vfio_virqfd
Below are results of lspci for the GTX 1660 Ti I'm using for passthrough:
Code:
03:00.0 VGA compatible controller: NVIDIA Corporation TU116 [GeForce GTX 1660 Ti] (rev a1) (prog-if 00 [VGA controller])
03:00.1 Audio device: NVIDIA Corporation TU116 High Definition Audio Controller (rev a1)
03:00.2 USB controller: NVIDIA Corporation TU116 USB 3.1 Host Controller (rev a1) (prog-if 30 [XHCI])
03:00.3 Serial bus controller: NVIDIA Corporation TU116 USB Type-C UCSI Controller (rev a1)

root@pve:~# lspci -n -s 03:00 -v
03:00.0 0300: 10de:2182 (rev a1) (prog-if 00 [VGA controller])
        Subsystem: 1458:3fc3
        Physical Slot: 6
        Flags: bus master, fast devsel, latency 0, IRQ 24, NUMA node 0, IOMMU group 56
        Memory at c6000000 (32-bit, non-prefetchable) [size=16M]
        Memory at b0000000 (64-bit, prefetchable) [size=256M]
        Memory at c0000000 (64-bit, prefetchable) [size=32M]
        I/O ports at 6000 [size=128]
        Expansion ROM at c7000000 [disabled] [size=512K]
        Capabilities: [60] Power Management version 3
        Capabilities: [68] MSI: Enable- Count=1/1 Maskable- 64bit+
        Capabilities: [78] Express Legacy Endpoint, MSI 00
        Capabilities: [100] Virtual Channel
        Capabilities: [258] L1 PM Substates
        Capabilities: [128] Power Budgeting <?>
        Capabilities: [420] Advanced Error Reporting
        Capabilities: [600] Vendor Specific Information: ID=0001 Rev=1 Len=024 <?>
        Capabilities: [900] Secondary PCI Express
        Capabilities: [bb0] Physical Resizable BAR
        Kernel driver in use: vfio-pci
        Kernel modules: nvidiafb, nouveau

03:00.1 0403: 10de:1aeb (rev a1)
        Subsystem: 1458:3fc3
        Physical Slot: 6
        Flags: bus master, fast devsel, latency 0, IRQ 38, NUMA node 0, IOMMU group 56
        Memory at c7080000 (32-bit, non-prefetchable) [size=16K]
        Capabilities: [60] Power Management version 3
        Capabilities: [68] MSI: Enable- Count=1/1 Maskable- 64bit+
        Capabilities: [78] Express Endpoint, MSI 00
        Capabilities: [100] Advanced Error Reporting
        Kernel driver in use: vfio-pci
        Kernel modules: snd_hda_intel

03:00.2 0c03: 10de:1aec (rev a1) (prog-if 30 [XHCI])
        Subsystem: 1458:3fc3
        Physical Slot: 6
        Flags: bus master, fast devsel, latency 0, IRQ 213, NUMA node 0, IOMMU group 56
        Memory at c2000000 (64-bit, prefetchable) [size=256K]
        Memory at c2040000 (64-bit, prefetchable) [size=64K]
        Capabilities: [68] MSI: Enable+ Count=1/1 Maskable- 64bit+
        Capabilities: [78] Express Endpoint, MSI 00
        Capabilities: [b4] Power Management version 3
        Capabilities: [100] Advanced Error Reporting
        Kernel driver in use: vfio-pci
        Kernel modules: xhci_pci

03:00.3 0c80: 10de:1aed (rev a1)
        Subsystem: 1458:3fc3
        Physical Slot: 6
        Flags: bus master, fast devsel, latency 0, IRQ 222, NUMA node 0, IOMMU group 56
        Memory at c7084000 (32-bit, non-prefetchable) [size=4K]
        Capabilities: [68] MSI: Enable+ Count=1/1 Maskable- 64bit+
        Capabilities: [78] Express Endpoint, MSI 00
        Capabilities: [b4] Power Management version 3
        Capabilities: [100] Advanced Error Reporting
        Kernel driver in use: vfio-pci
        Kernel modules: i2c_nvidia_gpu
/etc/modprobe.d/vfio.conf
Code:
options vfio-pci ids=10de:2182,10de:1aeb,10de:1aec,10de:1aed disable_vga=1

I hope I provided enough information. I mean, like I said, the VM itself seems to be running just fine, but I'm worried about all of the errors exponentially filling the journal.
Code:
root@pve:~# journalctl --disk-usage
Archived and active journals take up 194.3M in the file system.
root@pve:~# journalctl --verify
PASS: /var/log/journal/8cef86116857454faa3b558da6c69a46/system@00060911828b5d38-6b7ff2941c94eb44.journal~
PASS: /var/log/journal/8cef86116857454faa3b558da6c69a46/system.journal
PASS: /var/log/journal/8cef86116857454faa3b558da6c69a46/user-1000.journal
PASS: /var/log/journal/8cef86116857454faa3b558da6c69a46/user-1000@f4dee43b694e47a4a728257e008e6d09-0000000000001100-000608703aab58d6.journal
PASS: /var/log/journal/8cef86116857454faa3b558da6c69a46/system@00060911201b87f1-441d44f8604fb010.journal~
PASS: /var/log/journal/8cef86116857454faa3b558da6c69a46/system@3735a9fc4310409eb2bd8de63e9215cf-0000000000011b1a-0006091182892e9d.journal
PASS: /var/log/journal/8cef86116857454faa3b558da6c69a46/system@000608bb81e81d81-7754a38525570a35.journal~
I'm hoping someone out there can identify what I'm doing wrong. Thanks!!
(Edit: Added snapshot of syslog from web gui)
Last edited:

