Random kernel panics

One of the first warnings I get has to do with the E-cores

[0.204105] #17 #18 #19 #20 #21 #22 #23 #24 #25 #26 #27 #28 #29 #30 #31

Doesn't tell me anything but listing them out numerically. I have thought about disabling E-cores in bios and see if it still crashes. Haven't got around to trying it yet. Something some of you could also potentially try.
 
I'm trying disabling E-cores to see if that makes a difference. All my E-cores show up yellow as a warning.
Not sure if that matters but I have run out of ideas.

Jun 03 11:59:16 HOME-SERVER kernel: smp: Bringing up secondary CPUs ...
Jun 03 11:59:16 HOME-SERVER kernel: x86: Booting SMP configuration:
Jun 03 11:59:16 HOME-SERVER kernel: .... node #0, CPUs: #1 #2 #3 #4 #5 #6 #7 #8 #9 #10 #11 #12 #13 #14 #15 #16
Jun 03 11:59:16 HOME-SERVER kernel: core: cpu_atom PMU driver: PEBS-via-PT
Jun 03 11:59:16 HOME-SERVER kernel: ... version: 5
Jun 03 11:59:16 HOME-SERVER kernel: ... bit width: 48
Jun 03 11:59:16 HOME-SERVER kernel: ... generic registers: 6
Jun 03 11:59:16 HOME-SERVER kernel: ... value mask: 0000ffffffffffff
Jun 03 11:59:16 HOME-SERVER kernel: ... max period: 00007fffffffffff
Jun 03 11:59:16 HOME-SERVER kernel: ... fixed-purpose events: 3
Jun 03 11:59:16 HOME-SERVER kernel: ... event mask: 000000070000003f
Jun 03 11:59:16 HOME-SERVER kernel: #17 #18 #19 #20 #21 #22 #23 #24 #25 #26 #27 #28 #29 #30 #31
Jun 03 11:59:16 HOME-SERVER kernel: smp: Brought up 1 node, 32 CPUs
Jun 03 11:59:16 HOME-SERVER kernel: smpboot: Max logical packages: 1
Jun 03 11:59:16 HOME-SERVER kernel: smpboot: Total of 32 processors activated (127795.20 BogoMIPS)

To now this

Jun 05 17:42:09 HOME-SERVER kernel: smp: Bringing up secondary CPUs ...
Jun 05 17:42:09 HOME-SERVER kernel: x86: Booting SMP configuration:
Jun 05 17:42:09 HOME-SERVER kernel: .... node #0, CPUs: #1 #2 #3 #4 #5 #6 #7 #8 #9 #10 #11 #12 #13 #14 #15
Jun 05 17:42:09 HOME-SERVER kernel: smp: Brought up 1 node, 16 CPUs
Jun 05 17:42:09 HOME-SERVER kernel: smpboot: Max logical packages: 1
Jun 05 17:42:09 HOME-SERVER kernel: smpboot: Total of 16 processors activated (63897.60 BogoMIPS)

^^^^^ Seems like a bug in the message output only 15 cores listed even though I know its 8 physical cores 16 logical cores.
 
Last edited:
Thanks. Just an FYI. I'm currently trying with the VM hard disks configured with aio=native. Seems like that may have helped others in the past. I'll report back with the results.
I'm also trying this now - came across similar threads and seems like something easy to try. Will also be reporting back at some point should this seem to do the trick...
 
I really appreciate how supportive this community is. Just wanted to report in. I had been trying to disable C-states via bios with no success.

I then added the following to my grub config and it seems to be helping.

GRUB_CMDLINE_LINUX_DEFAULT="quiet intel_idle.max_cstate=1 processor.max_cstate=1"

There are a number of forum posters with people using similar kernel configs. Was getting crashes every few hours and have managed almost 4 days of uptime.

Will report back on whether this holds.
 
  • Like
Reactions: KingDigweed
GRUB_CMDLINE_LINUX_DEFAULT="quiet intel_idle.max_cstate=1 processor.max_cstate=1"
Interesting.....I was able to modify my bios to restrict C-states with the same results, no crashes. My issues is that with C-states enabled idle power is 40w with C-states disabled idle power was 120w and processor temps were fairly high. Curious as to what your idle power consumption and processor temps are.
 
Interesting.....I was able to modify my bios to restrict C-states with the same results, no crashes. My issues is that with C-states enabled idle power is 40w with C-states disabled idle power was 120w and processor temps were fairly high. Curious as to what your idle power consumption and processor temps are.
Give it a try with "intel_idle.max_cstate=1 processor.max_cstate=5". This setting seems to have given my AMD based system stability while maintaining reasonable power usage. Based on the open Linux bugs it appears the cstate >=6 is where troubles start.
 
With E-cores disabled I am past 2 days without a crash which my machine has never done before. Idle power is still 40w as C-states are still enabled. I will continue to keep this running and see if the progress remains.
 
Interesting.....I was able to modify my bios to restrict C-states with the same results, no crashes. My issues is that with C-states enabled idle power is 40w with C-states disabled idle power was 120w and processor temps were fairly high. Curious as to what your idle power consumption and processor temps are.

I'm not sure what folks are using to measure power draw. I have 6 1L proxmox nodes, a synology 1821, and some networking hardware hooked up to two UPSs, which collectively show about 270 watts (much of that is the NAS). For myself, I didn't notice this noticeably change when I changed my C-state settings.

I'll try to change to these settings on my next reboot and see if that reduces any of the power consumption.

intel_idle.max_cstate=1 processor.max_cstate=5

In the meantime, I ran powerstat and lm-sensors (sensors) on the two nodes that were crashing (with the new c-state settings) and got this output. Temps seem to be on the normal side, given these are 1L machines with limited air circulation and two M.2 NVMe drives installed.

Also currently going on 6 days without a crash. Wooo.

Code:
# powerstat -R
Running for 60.0 seconds (60 samples at 1.0 second intervals).
Power measurements will start in 0 seconds time.

  Time    User  Nice   Sys  Idle    IO  Run Ctxt/s  IRQ/s Fork Exec Exit  Watts
16:30:25   2.8   0.0   0.4  95.8   0.9    2  19968   9774    0    0    0  18.29
16:30:26   1.8   0.0   0.5  96.8   0.9    1  19791   9893    0    0    0  17.78
16:30:27   2.3   0.0   0.6  96.2   0.9    3  20520  10397   38    3   37  18.79
16:30:28   2.1   0.0   0.4  96.4   1.0    1  19390   9751    3    1    4  18.42
16:30:29   3.4   0.0   0.3  95.3   1.0    1  19405   9706    0    0    0  19.60
16:30:30   2.7   0.0   0.4  96.0   0.8    1  20063  10217    0    0    0  18.89

Code:
# powerstat -R
Running for 60.0 seconds (60 samples at 1.0 second intervals).
Power measurements will start in 0 seconds time.

  Time    User  Nice   Sys  Idle    IO  Run Ctxt/s  IRQ/s Fork Exec Exit  Watts
16:35:20   3.1   0.0   0.6  95.4   0.9    1  21611  11386    0    0    0  20.31
16:35:21   3.4   0.0   0.4  95.3   0.8    1  20945  11068   17   17   17  19.57
16:35:22   3.4   0.0   0.4  95.1   1.1    1  24375  12164    0    0    0  20.61
16:35:23   4.5   0.0   0.5  94.0   0.9    2  22118  11434    1    0    0  21.58
16:35:24   3.6   0.0   0.5  94.8   1.1    1  23612  11986    0    0    0  20.33

Code:
# sensors
nvme-pci-0200
Adapter: PCI adapter
Composite:    +51.9°C  (low  = -273.1°C, high = +81.8°C)
                       (crit = +84.8°C)
Sensor 1:     +51.9°C  (low  = -273.1°C, high = +65261.8°C)
Sensor 2:     +50.9°C  (low  = -273.1°C, high = +65261.8°C)

acpitz-acpi-0
Adapter: ACPI interface
temp1:        +58.0°C  (crit = +105.0°C)

coretemp-isa-0000
Adapter: ISA adapter
Package id 0:  +58.0°C  (high = +80.0°C, crit = +100.0°C)
Core 0:        +58.0°C  (high = +80.0°C, crit = +100.0°C)
Core 1:        +57.0°C  (high = +80.0°C, crit = +100.0°C)
Core 2:        +58.0°C  (high = +80.0°C, crit = +100.0°C)
Core 3:        +56.0°C  (high = +80.0°C, crit = +100.0°C)
Core 4:        +56.0°C  (high = +80.0°C, crit = +100.0°C)
Core 5:        +58.0°C  (high = +80.0°C, crit = +100.0°C)
Core 6:        +56.0°C  (high = +80.0°C, crit = +100.0°C)
Core 7:        +56.0°C  (high = +80.0°C, crit = +100.0°C)

nvme-pci-0300
Adapter: PCI adapter
Composite:    +53.9°C  (low  = -273.1°C, high = +81.8°C)
                       (crit = +84.8°C)
Sensor 1:     +53.9°C  (low  = -273.1°C, high = +65261.8°C)
Sensor 2:     +64.8°C  (low  = -273.1°C, high = +65261.8°C)

Code:
# sensors
nvme-pci-0200
Adapter: PCI adapter
Composite:    +48.9°C  (low  = -273.1°C, high = +81.8°C)
                       (crit = +84.8°C)
Sensor 1:     +48.9°C  (low  = -273.1°C, high = +65261.8°C)
Sensor 2:     +58.9°C  (low  = -273.1°C, high = +65261.8°C)

acpitz-acpi-0
Adapter: ACPI interface
temp1:        +51.0°C  (crit = +105.0°C)

coretemp-isa-0000
Adapter: ISA adapter
Package id 0:  +55.0°C  (high = +80.0°C, crit = +100.0°C)
Core 0:        +52.0°C  (high = +80.0°C, crit = +100.0°C)
Core 1:        +50.0°C  (high = +80.0°C, crit = +100.0°C)
Core 2:        +55.0°C  (high = +80.0°C, crit = +100.0°C)
Core 3:        +50.0°C  (high = +80.0°C, crit = +100.0°C)
Core 4:        +51.0°C  (high = +80.0°C, crit = +100.0°C)
Core 5:        +51.0°C  (high = +80.0°C, crit = +100.0°C)
Core 6:        +50.0°C  (high = +80.0°C, crit = +100.0°C)
Core 7:        +48.0°C  (high = +80.0°C, crit = +100.0°C)

nvme-pci-0300
Adapter: PCI adapter
Composite:    +46.9°C  (low  = -273.1°C, high = +84.8°C)
                       (crit = +84.8°C)
Sensor 1:     +46.9°C  (low  = -273.1°C, high = +65261.8°C)
Sensor 2:     +39.9°C  (low  = -273.1°C, high = +65261.8°C)
 
Last edited:
I'm not sure what folks are using to measure power draw. I have 6 1L proxmox nodes, a synology 1821, and some networking hardware hooked up to two UPSs, which collectively show about 270 watts (much of that is the NAS). For myself, I didn't notice this noticeably change when I changed my C-state settings.


coretemp-isa-0000
Adapter: ISA adapter
Package id 0: +58.0°C (high = +80.0°C, crit = +100.0°C)
Core 0: +58.0°C (high = +80.0°C, crit = +100.0°C)
Core 1: +57.0°C (high = +80.0°C, crit = +100.0°C)
Core 2: +58.0°C (high = +80.0°C, crit = +100.0°C)
Core 3: +56.0°C (high = +80.0°C, crit = +100.0°C)
Core 4: +56.0°C (high = +80.0°C, crit = +100.0°C)
Core 5: +58.0°C (high = +80.0°C, crit = +100.0°C)
Core 6: +56.0°C (high = +80.0°C, crit = +100.0°C)
Core 7: +56.0°C (high = +80.0°C, crit = +100.0°C)
I am using a standalone plug that my NAS plugs into that shows me the power consumed fairly cheap device. 40W idle with C-states enabled, 120w idle with C-states disabled
https://www.amazon.com/dp/B09BQNYMMM

Your temps are quite a bit higher then mine idle but it's what I would expect with C-states disabled. Which CPU model do you have? Mine is the I9-13900

root@HOME-SERVER:~# sensors
coretemp-isa-0000
Adapter: ISA adapter
Package id 0: +40.0°C (high = +80.0°C, crit = +100.0°C)
Core 0: +36.0°C (high = +80.0°C, crit = +100.0°C)
Core 4: +35.0°C (high = +80.0°C, crit = +100.0°C)
Core 8: +37.0°C (high = +80.0°C, crit = +100.0°C)
Core 12: +36.0°C (high = +80.0°C, crit = +100.0°C)
Core 16: +35.0°C (high = +80.0°C, crit = +100.0°C)
Core 20: +36.0°C (high = +80.0°C, crit = +100.0°C)
Core 24: +34.0°C (high = +80.0°C, crit = +100.0°C)
Core 28: +37.0°C (high = +80.0°C, crit = +100.0°C)

If this continues to hold up I will turn a couple E-cores on and see where it crashes. It would appear to me the issue is C-states with E-cores.

powerstat doesn't appear to be that accurate just my observation. The below is actually consuming 40w

Code:
  Time    User  Nice   Sys  Idle    IO  Run Ctxt/s  IRQ/s Fork Exec Exit  Watts
19:40:59   0.1   0.0   0.0  99.9   0.0    1    296    175    0    0    0   3.24
19:41:00   0.1   0.1   0.1  99.8   0.0    1    274    172    0    0    0   3.09
19:41:01   0.1   0.0   0.1  99.8   0.0    2    392    187    2    1    2   3.19
19:41:02   0.3   0.0   0.4  99.3   0.0    1    492    426    7    3    6   4.24
19:41:03   0.2   0.0   0.8  99.0   0.0    1    774    428   19   17   19   4.00
19:41:04   0.1   0.0   0.1  99.8   0.0    1    351    251    0    0    0   3.22
19:41:05   0.0   0.0   0.1  99.9   0.0    1    293    170    0    0    0   3.03
19:41:06   0.1   0.0   0.0  99.9   0.0    1    288    182    0    0    0   3.41
19:41:07   0.1   0.0   0.0  99.9   0.0    1    244    161    0    0    0   3.10
19:41:08   0.1   0.0   0.1  99.8   0.0    1    336    210    0    0    0   3.42
19:41:09   0.0   0.0   0.0 100.0   0.0    1    315    158    0    0    0   2.98
19:41:10   0.0   0.0   0.0 100.0   0.0    1    221    137    0    0    0   2.90
19:41:11   0.0   0.0   0.0 100.0   0.0    1    259    164    0    0    0   3.22
19:41:12   0.5   0.0   0.4  99.1   0.0    2    661    472    8    4    9   4.67


 Average   0.1   0.0   0.1  99.7   0.0  1.1  371.1  235.2  2.6  1.8  2.6   3.41
 GeoMean   0.0   0.0   0.0  99.7   0.0  1.1  345.9  215.0  0.0  0.0  0.0   3.37
  StdDev   0.1   0.0   0.2   0.3   0.0  0.3  157.1  111.4  5.2  4.4  5.3   0.50
-------- ----- ----- ----- ----- ----- ---- ------ ------ ---- ---- ---- ------
 Minimum   0.0   0.0   0.0  99.0   0.0  1.0  221.0  137.0  0.0  0.0  0.0   2.90
 Maximum   0.5   0.1   0.8 100.0   0.0  2.0  774.0  472.0 19.0 17.0 19.0   4.67
-------- ----- ----- ----- ----- ----- ---- ------ ------ ---- ---- ---- ------
Summary:
CPU:   3.41 Watts on average with standard deviation 0.50
Note: power read from RAPL domains: uncore, package-0, core.
These readings do not cover all the hardware in this device.
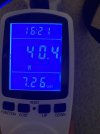

image0 - Copy - Copy.jpg
 
Last edited:

About

The Proxmox community has been around for many years and offers help and support for Proxmox VE, Proxmox Backup Server, and Proxmox Mail Gateway.
We think our community is one of the best thanks to people like you!

Get your subscription!

The Proxmox team works very hard to make sure you are running the best software and getting stable updates and security enhancements, as well as quick enterprise support. Tens of thousands of happy customers have a Proxmox subscription. Get yours easily in our online shop.

Buy now!