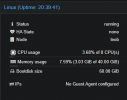
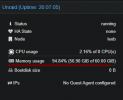
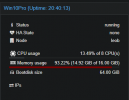
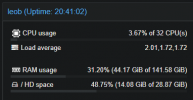
Its also the question what you define as "free" and "used" and how you handle "available" memory.
Example:
A VM that got 10 GB RAM assigned where inside the guest 2GB are used for system/user processes, 7GB are used for caching and 1GB is free. There is also virtualization overhead of 1GB. Lets say that VM is using PCI passthrough where then always the full RAM will be allocated, because PCI devices could use DMA and that requires that the device could directly access all of the memory at all times.
So in reality that VM actually consumes 11GB of physical RAM that can't be used by the host itself or any other guest. This is what you for example will see when running htop and look at the kvm process. and this is what PVE will show you in the webUI if you don't enabled the qemu guest agent for yur hosts.
Then you got the point of view of the guest OS. The guest OS can't know of the virtualization overhead so this additional 1GB is missing. And then there is the point of how you visualize "available" RAM. With this example a guest Linux will tell you that 9GB are "used", 1GB is "free" and 8GB are "available". Many programs will show this "available" RAM as something like free RAM even if that RAM in reality isn't free, because when needed the guest OS could quickly drop the caches to free up additional 7GB. So cached data is basically handled as free.
From the hosts perspective "available" RAM is just "used" RAM as the host can't drop caches of a guest.
With modern OSs they probably use up all RAM you throw at them and are always at over 90% RAM usage even if they don't show it that way. Because at baremetal hosts unused RAM is wasted RAM, so even if no program actually needs it, the guest will use all of it for caching.
And when using the QEMU guest agent you will see different RAM usages depending on the guest OS you are using.
Unix: FreeBSDs guest agent implementation for example won't report any RAM usages so PVE will just use the RAM usage of the KVM process as a fallback. So all "available" RAM will be shown as "used" RAM + overhead.
Linux: the Linux implementation of the guest agent will show "available" RAM as "used" RAM
Windows: the Windows implementation will show "available" RAM as "free" RAM
So what you see in the PVE webUI also depends on the guest OS that VM is running.
For a better understanding of "available" RAM you might want to read this:
LinuxAteMyRAM.com