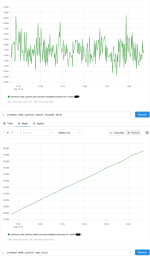
| Metric Name | Meaning |
| `proxmox_node_uptime_seconds` | Host uptime in seconds. |
| `proxmox_node_cpustat_cpu_percent` | Current node CPU usage percentage. |
| `proxmox_node_cpustat_avg1_ratio` | 1-minute load average. |
| `proxmox_node_cpustat_avg5_ratio` | 5-minute load average. |
| `proxmox_node_cpustat_avg15_ratio` | 15-minute load average. |
| `proxmox_node_cpustat_cpus_ratio` | Number of CPUs / CPU capacity value, depending on exporter conversion. |
| `proxmox_node_cpustat_user_seconds_total` | Cumulative CPU time spent in user mode. Use with `rate()`. |
| `proxmox_node_cpustat_system_seconds_total` | Cumulative CPU time spent in kernel/system mode. Use with `rate()`. |
| `proxmox_node_cpustat_idle_seconds_total` | Cumulative idle CPU time. Use with `rate()`. |
| `proxmox_node_cpustat_iowait_seconds_total` | Cumulative CPU time waiting for I/O. Use with `rate()`. |
| `proxmox_node_cpustat_irq_seconds_total` | Cumulative CPU time servicing hardware interrupts. |
| `proxmox_node_cpustat_softirq_seconds_total` | Cumulative CPU time servicing software interrupts. |
| `proxmox_node_cpustat_steal_seconds_total` | Cumulative stolen CPU time, mainly relevant when nested/virtualized. |
| `proxmox_node_memory_memtotal_bytes` | Total node RAM. |
| `proxmox_node_memory_memused_bytes` | Used node RAM. |
| `proxmox_node_memory_memfree_bytes` | Free node RAM. |
| `proxmox_node_memory_memavailable_bytes` | Available RAM estimate. Usually better than free memory. |
| `proxmox_node_memory_swaptotal_bytes` | Total swap. |
| `proxmox_node_memory_swapused_bytes` | Used swap. |
| `proxmox_node_memory_swapfree_bytes` | Free swap. |
| `proxmox_node_memory_arcsize_bytes` | Current ZFS ARC size. |
| `proxmox_node_memory_arcmax_ratio` | ZFS ARC max value/ratio as exported. |
| `proxmox_node_memory_arcmin_ratio` | ZFS ARC min value/ratio as exported. |
| `proxmox_node_network_receive_bytes_total` | Cumulative node network receive bytes. Use `rate()`. |
| `proxmox_node_network_transmit_bytes_total` | Cumulative node network transmit bytes. Use `rate()`. |
| `proxmox_node_blockstat_blocks_bytes` | Total block capacity. |
| `proxmox_node_blockstat_bfree_bytes` | Free blocks. |
| `proxmox_node_blockstat_bavail_bytes` | Available blocks for non-root/user. |
| `proxmox_node_blockstat_used_bytes` | Used block space. |
| `proxmox_node_blockstat_per_percent` | Used percentage. |
| `proxmox_node_blockstat_files_ratio` | Total inode/file count value as exported. |
| `proxmox_node_blockstat_ffree_bytes` | Free inode/file count value, despite the `_bytes` suffix. |
| `proxmox_node_blockstat_favail_bytes` | Available inode/file count value, despite the `_bytes` suffix. |
| `proxmox_node_blockstat_fused_bytes` | Used inode/file count value, despite the `_bytes` suffix. |
| `proxmox_node_blockstat_fper_percent` | Inode/file usage percentage. |
| `proxmox_node_blockstat_su_*` | Superuser/root-reserved block or inode stats. |
| `proxmox_node_blockstat_user_*` | User-available/user-used block or inode stats. |
| `proxmox_vm_cpu_percent` | Current VM/CT CPU usage percentage. |
| `proxmox_vm_cpus_ratio` | Configured vCPU count/capacity value. |
| `proxmox_vm_cpus_percent` | CPU allocation/capacity value as percent. |
| `proxmox_vm_mem_bytes` | Guest memory usage. |
| `proxmox_vm_memhost_bytes` | Memory consumed on host side. |
| `proxmox_vm_maxmem_bytes` | Configured maximum memory. |
| `proxmox_vm_freemem_bytes` | Free memory reported by guest agent/ballooning, if available. |
| `proxmox_vm_swap_bytes` | Swap usage. |
| `proxmox_vm_maxswap_bytes` | Configured maximum swap, mostly relevant for containers. |
| `proxmox_vm_disk_bytes` | Current disk usage, commonly for containers or where usage is known. |
| `proxmox_vm_maxdisk_bytes` | Configured/known maximum disk size. |
| `proxmox_vm_diskread_bytes_total` | Cumulative disk read bytes. Use `rate()`. |
| `proxmox_vm_diskwrite_bytes_total` | Cumulative disk written bytes. Use `rate()`. |
| `proxmox_vm_netin_bytes_total` | Cumulative network receive bytes. Use `rate()`. |
| `proxmox_vm_netout_bytes_total` | Cumulative network transmit bytes. Use `rate()`. |
| `proxmox_vm_uptime_seconds` | VM/container uptime. |
| `proxmox_vm_balloon_ratio` | Ballooning value/ratio. |
| `proxmox_vm_ballooninfo_actual_ratio` | Actual balloon memory value as exported. |
| `proxmox_vm_ballooninfo_max_mem_bytes` | Maximum memory known to balloon driver. |
| `proxmox_vm_ballooninfo_total_mem_bytes` | Total guest memory from balloon stats. |
| `proxmox_vm_ballooninfo_free_mem_bytes` | Free guest memory from balloon stats. |
| `proxmox_vm_ballooninfo_mem_swapped_in_bytes` | Memory swapped in according to balloon stats. |
| `proxmox_vm_ballooninfo_mem_swapped_out_bytes` | Memory swapped out according to balloon stats. |
| `proxmox_vm_ballooninfo_major_page_faults_ratio` | Major page faults from balloon stats. |
| `proxmox_vm_ballooninfo_minor_page_faults_ratio` | Minor page faults from balloon stats. |
| `proxmox_vm_ballooninfo_last_update_ratio` | Last balloon stat update value/timestamp-like value. |
| `proxmox_vm_pressurecpusome_percent` | Some tasks waiting for CPU. CPU pressure. |
| `proxmox_vm_pressurecpufull_percent` | All non-idle tasks waiting for CPU. More severe CPU pressure. |
| `proxmox_vm_pressureiosome_ratio` | Some tasks stalled on I/O. |
| `proxmox_vm_pressureiofull_ratio` | Full I/O pressure. |
| `proxmox_vm_pressurememorysome_bytes` | Memory pressure “some” value, despite odd suffix. |
| `proxmox_vm_pressurememoryfull_bytes` | Memory pressure “full” value, despite odd suffix. |
| `proxmox_storage_total_bytes` | Total storage capacity. |
| `proxmox_storage_used_bytes` | Used storage capacity. |
| `proxmox_storage_avail_bytes` | Available storage capacity. |
| `proxmox_storage_active_ratio` | Whether storage is active/reachable; usually `1` active, `0` inactive. |
| `proxmox_storage_enabled_ratio` | Whether storage is enabled; usually `1` enabled, `0` disabled. |
| `proxmox_storage_shared_ratio` | Whether storage is shared; usually `1` shared, `0` not shared. |