Hi
Simply put I have the following scenario:
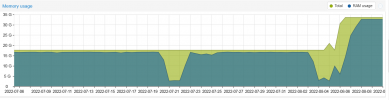
I am running PVE 6.3.2 and have a VM with 16 Gigs of Ram and it was all of sudden consuming all the RAM which leads to the machine hanging up. So we increased the RAM up to 32 Gigs of Ram but nothing really changed. The problem is that the VM is not running any serious tasks. The imgs below tell it all.
This is the RAM usage as reported from the PVE-Admin panel:

The VM is centos and is showing this:

So the VM internally is reporting 1.59 Gigs of Ram usage while the PVE-panel is showing 17 Gigs of ram Usage, how can I find who is hogging the RAM and any idea on how to start debugging it?
Thx.
Simply put I have the following scenario:
I am running PVE 6.3.2 and have a VM with 16 Gigs of Ram and it was all of sudden consuming all the RAM which leads to the machine hanging up. So we increased the RAM up to 32 Gigs of Ram but nothing really changed. The problem is that the VM is not running any serious tasks. The imgs below tell it all.
This is the RAM usage as reported from the PVE-Admin panel:
The VM is centos and is showing this:
So the VM internally is reporting 1.59 Gigs of Ram usage while the PVE-panel is showing 17 Gigs of ram Usage, how can I find who is hogging the RAM and any idea on how to start debugging it?
Thx.