PVE reports too high memory usage

Andrearighe

New Member
Aug 19, 2022
5
2
3
Hi all.
I have a little cluster of two PVE servers 7.2 with 64Gb of RAM. The first is running two VMs, a Windows 2019 Std server with fixed 32Gb of RAM running SQL Server, the second is an Ubuntu 20.04 with fixed 4Gb of RAM that is a webmail server.
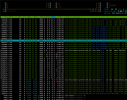
While Windows reports to use 80% or more of his RAM and Ubuntu don't exceed 1Gb of used RAM, the PVE itself shows a "red line" about RAM that represents over 55 Gb used.
PVE uses much more RAM of the two VMs togheter.
I have three other cluster with the same configuration and none of these show the same issue.
I simply don't care about it during the last six months but now i would like to understand because i would like to add a third VM.
When i restart Windows Server, his RAM usage falls to 10Gb of RAM but PVE still report 45 Gb of RAM used of 64 available. Ubuntu remain to 0,5 Gb of RAM used.
Thanks to everyone
 
Please provide the full output from the PVE-host in code-tags of:
  • arc_summary -s arc
  • free -h
 
Do you use ZFS as Neobin is asking?

Assume Windows VMs will use "all" RAM because they cache heavily and Ubuntu may be using most of it for the same reason.

You can use HTOP on PVE and press F6 to sort by memory usage. HTOP will also quickly show three memory colors.
1. Green is allocated (Host, VMs, services)
2. Blue is unwritten buffer waiting to go to disk.
3. Yellow is cache for the host. You can clear cache but I don't think it shows up in PVE GUI unless it's Arc cache from ZFS.

If it is ZFS, the default configuration is to use 50% of host memory. You can reconfigure this easily but may see a performance benefit. High disk usage VMs will encourage ZFS to cache more.

Thanks,


Tmanok
 
root@pve1:~# arc_summary -s arc

------------------------------------------------------------------------
ZFS Subsystem Report Wed Feb 15 15:22:19 2023
Linux 5.15.30-2-pve 2.1.4-pve1
Machine: pve1 (x86_64) 2.1.4-pve1

ARC status: HEALTHY
Memory throttle count: 0

ARC size (current): 83.3 % 26.1 GiB
Target size (adaptive): 83.3 % 26.1 GiB
Min size (hard limit): 6.2 % 2.0 GiB
Max size (high water): 16:1 31.3 GiB
Most Frequently Used (MFU) cache size: 0.7 % 168.2 MiB
Most Recently Used (MRU) cache size: 99.3 % 24.2 GiB
Metadata cache size (hard limit): 75.0 % 23.5 GiB
Metadata cache size (current): 9.6 % 2.2 GiB
Dnode cache size (hard limit): 10.0 % 2.3 GiB
Dnode cache size (current): 0.1 % 1.5 MiB

ARC hash breakdown:
Elements max: 7.3M
Elements current: 77.6 % 5.7M
Collisions: 4.3G
Chain max: 10
Chains: 1.2M

ARC misc:
Deleted: 7.9G
Mutex misses: 3.2M
Eviction skips: 17.9M
Eviction skips due to L2 writes: 0
L2 cached evictions: 0 Bytes
L2 eligible evictions: 63.8 TiB
L2 eligible MFU evictions: 9.7 % 6.2 TiB
L2 eligible MRU evictions: 90.3 % 57.6 TiB
L2 ineligible evictions: 415.3 GiB

root@pve1:~#
root@pve1:~# free -h
total used free shared buff/cache available
Mem: 62Gi 59Gi 1.6Gi 47Mi 1.4Gi 2.3Gi
Swap: 8.0Gi 832Mi 7.2Gi
root@pve1:~#

Thank you Neobin
 
  • Like
Reactions: Tmanok

About

The Proxmox community has been around for many years and offers help and support for Proxmox VE, Proxmox Backup Server, and Proxmox Mail Gateway.
We think our community is one of the best thanks to people like you!

Get your subscription!

The Proxmox team works very hard to make sure you are running the best software and getting stable updates and security enhancements, as well as quick enterprise support. Tens of thousands of happy customers have a Proxmox subscription. Get yours easily in our online shop.

Buy now!