[SOLVED] pve-esxi-import-tools 0.7.4 / WebUI errors

May 16, 2025
16
0
1
Hello,

I have run into an issue with the ESXi import feature. If I start from scratch:

Datacenter -> storage -> Add -> ESXi

Fill in the appropriate details, and check the "Skip Certificate Verification" checkbox, then click "Add"
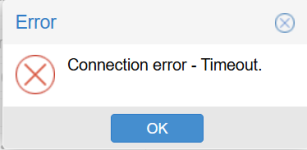
After some time, I get an error

1749232954335.png

If I try to click the "Add" button a second time I see

1749233148547.png

If I then try to click on the "esx01" storage icon, I will get a "communication failure"

1749233230486.png

However, if I attempt to run the listvms.py via the CLI, it returns the list of VMs from the ESXi host.

Code:
root@pve01:/usr/libexec/pve-esxi-import-tools# ./listvms.py --skip-cert-verification 10.210.10.111 root /etc/pve/priv/storage/esx01.pw
Skipping vCLS agent VM: vCLS-f83e5741-60e2-4f39-9b55-b0aaf8569b89
Skipping vCLS agent VM: vCLS-e263bbb6-9c9e-4d3f-aacb-c6fcda8f6698
{
  "ha-datacenter": {
    "vms": {
       "VMName0001": {
        "config": {
          "datastore": "CONTENT",
          "path": "VMName0001/VMName0001.vmx",
          "checksum": "2cf9c3cdf19941b23102690e1c470bd318d74ece"
        },
        "disks": [
          {
            "datastore": "CONTENT",
            "path": "VMName0001/VMName0001.vmdk",
            "capacity": 64424509440
          }
        ],
        "power": "poweredOff"
      },
     .... more vms....
    },
    "datastores": {
      "CONTENT": "/vmfs/volumes/643e945a-b52837b6-4ffa-801844e77a66/",
      "SCRATCH": "/vmfs/volumes/6421c596-0f2a88c2-8082-b496918def7c/"
    }
  }
}

Any ideas as to what might be going on here?

Thanks,
 
So, I thought this was an MTU issue. The last thing I did after updating the MTU was click the storage icon is the webUI, it returned immediately so I assumed all was good. Trying again this morning, I am seeing the same issue.

NOTE: On occasion, the webUI will display the list of the VMs on the ESXi host. If it does display, the "Import Guest" dialog will timeout after clicking the import button.

Are the MTUs consistent?

On pve03, vlan0310 is the interface communicating with the ESXi host, as well as the interface used for PVE management (the webUI).

Code:
root@pve03:/usr/libexec/pve-esxi-import-tools# ip l show dev enp129s0f1np1
7: enp129s0f1np1: <BROADCAST,MULTICAST,SLAVE,UP,LOWER_UP> mtu 9000 qdisc mq master bond1 state UP mode DEFAULT group default qlen 1000
    link/ether 6c:fe:54:34:b7:b1 brd ff:ff:ff:ff:ff:ff
root@pve03:/usr/libexec/pve-esxi-import-tools# ip l show dev enp131s0f1np1
9: enp131s0f1np1: <BROADCAST,MULTICAST,SLAVE,UP,LOWER_UP> mtu 9000 qdisc mq master bond1 state UP mode DEFAULT group default qlen 1000
    link/ether 6c:fe:54:34:b7:b1 brd ff:ff:ff:ff:ff:ff permaddr 6c:fe:54:34:b8:81
root@pve03:/usr/libexec/pve-esxi-import-tools# ip link show dev bond1
11: bond1: <BROADCAST,MULTICAST,MASTER,UP,LOWER_UP> mtu 9000 qdisc noqueue state UP mode DEFAULT group default qlen 1000
    link/ether 6c:fe:54:34:b7:b1 brd ff:ff:ff:ff:ff:ff
root@pveo03:/usr/libexec/pve-esxi-import-tools# ip l show dev vlan0310
17: vlan0310@bond1: <BROADCAST,MULTICAST,UP,LOWER_UP> mtu 1500 qdisc noqueue state UP mode DEFAULT group default qlen 1000
    link/ether 6c:fe:54:34:b7:b1 brd ff:ff:ff:ff:ff:ff

On the ESXi side. vmnic5 and vmnic7 are the uplinks for the distributed switch where the vmk0 (management), the other vmnics (4,6) are connected to storage.

Code:
Name    PCI Device    Driver  Admin Status  Link Status  Speed  Duplex  MAC Address         MTU  Description
------  ------------  ------  ------------  -----------  -----  ------  -----------------  ----  -----------
vmnic4  0000:81:00.0  i40en   Up            Up           10000  Full    6c:fe:54:34:b8:70  9000  Intel(R) Ethernet Controller X710 for 10GbE SFP+
vmnic5  0000:81:00.1  i40en   Up            Up           10000  Full    6c:fe:54:34:b8:71  1500  Intel(R) Ethernet Controller X710 for 10GbE SFP+
vmnic6  0000:83:00.0  i40en   Up            Up           10000  Full    6c:fe:54:34:b7:90  9000  Intel(R) Ethernet Controller X710 for 10GbE SFP+
vmnic7  0000:83:00.1  i40en   Up            Up           10000  Full    6c:fe:54:34:b7:91  1500  Intel(R) Ethernet Controller X710 for 10GbE SFP+

ESXi and PVE communicate with each other over VLAN0310 (i.e. same subnet)

Is there anything in the "journalctl" ?

There is nothing in journalctl that jumps out at me.

What does pvesm status say?

Code:
root@pve03:/usr/libexec/pve-esxi-import-tools# pvesm status
Name             Type     Status           Total            Used       Available        %
esx01            esxi     active               0               0               0    0.00%
local             dir     active        98497780         9423556        84024676    9.57%
local-lvm     lvmthin     active      5697167360        15382351      5681785008    0.27%
 
Everything points to a network problem.

On pve03, vlan0310 is the interface communicating with the ESXi host, as well as the interface used for PVE management (the webUI).
It’s often the case in the forum that what users believe their network connectivity to be doesn’t always match the actual configuration or behavior.
There’s no simple "knob" in Proxmox VE that resolves unexplained network timeouts. These issues require investigation and root cause analysis.
If you're confident in your IP addressing, MTU settings, and general network design, the next step is to capture a network trace.

If you'd like a second set of eyes on it, please share the following at minimum:

- IP address layout
- Switch interconnects and relevant configuration
- Ideally, a clear network diagram

You can review the ESXi storage plugin here: /usr/share/perl5/PVE/Storage/ESXiPlugin.pm


Blockbridge : Ultra low latency all-NVME shared storage for Proxmox - https://www.blockbridge.com/proxmox
 
Seems like it could be a network problem... however, that is the only part of the proxmox UI that has so far caused me any issues. I have been able to upload a number of ISO images from my workstation to the host with no (noticeable?) issues. As I was writing, I uploaded the proxmox datacenter manager ISO to the host, according to the status it took 11.3s to upload 1.22GB of data.

There is a VM deployed with a network device connected to vmbr0 (part of bond1), accessing the Proxmox API via a second network device connected to vmbr2 (vmbr2 has no external connectivity). The VM runs a web app accessed via vmbr0, the end user accessing the web app has (up until this point) reported no issues.

More than willing to try things to figure out what is going on.

Information (some details have been modified to protect the innocent):

Proxmox:

ESXi storage configuration
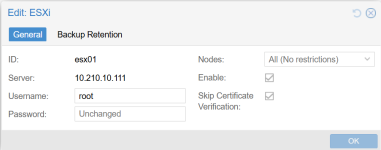
1749561101923.png

IP address configuration:

NOTE: I connect to https://10.210.10.112:8006 to access the management webUI on pve03
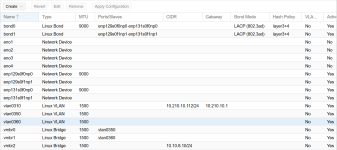
1749559928099.png

pve03 Interface state:

NOTE: bond0 is down

Code:
root@pve03:/usr/libexec/pve-esxi-import-tools# ethtool bond0 | grep -P "Speed|Link"
        Speed: Unknown!
        Link detected: no
root@pve03:/usr/libexec/pve-esxi-import-tools# ethtool bond1 | grep -P "Speed|Link"
        Speed: 20000Mb/s
        Link detected: yes

esx01 host:

NOTES:
I can reach the ESXi webUI (not VCenter) via https://10.210.10.111
vmnic0 is connected to a switch, but no traffic is using the interface

Code:
[root@esx01:~] esxcli network ip interface ipv4 get
Name  IPv4 Address   IPv4 Netmask   IPv4 Broadcast  Address Type  Gateway      DHCP DNS
----  -------------  -------------  --------------  ------------  -----------  --------
vmk0  10.210.10.111  255.255.255.0  10.210.10.255   STATIC        10.210.10.1     false
vmk1  10.249.0.111   255.255.255.0  10.249.0.255    STATIC        10.210.10.1     false
vmk2  10.249.2.111   255.255.255.0  10.249.2.255    STATIC        10.210.10.1     false
[root@esx01:~] esxcli network nic list
Name    PCI Device    Driver  Admin Status  Link Status  Speed  Duplex  MAC Address         MTU  Description
------  ------------  ------  ------------  -----------  -----  ------  -----------------  ----  -----------
vmnic0  0000:01:00.0  ntg3    Up            Up            1000  Full    80:18:44:e7:7a:64  1500  Broadcom Corporation NetXtreme BCM5720 Gigabit Ethernet
vmnic1  0000:01:00.1  ntg3    Up            Down             0  Half    80:18:44:e7:7a:65  1500  Broadcom Corporation NetXtreme BCM5720 Gigabit Ethernet
vmnic2  0000:02:00.0  ntg3    Up            Down             0  Half    80:18:44:e7:7a:66  1500  Broadcom Corporation NetXtreme BCM5720 Gigabit Ethernet
vmnic3  0000:02:00.1  ntg3    Up            Down             0  Half    80:18:44:e7:7a:67  1500  Broadcom Corporation NetXtreme BCM5720 Gigabit Ethernet
vmnic4  0000:81:00.0  i40en   Up            Up           10000  Full    6c:fe:54:34:b8:70  9000  Intel(R) Ethernet Controller X710 for 10GbE SFP+
vmnic5  0000:81:00.1  i40en   Up            Up           10000  Full    6c:fe:54:34:b8:71  1500  Intel(R) Ethernet Controller X710 for 10GbE SFP+
vmnic6  0000:83:00.0  i40en   Up            Up           10000  Full    6c:fe:54:34:b7:90  9000  Intel(R) Ethernet Controller X710 for 10GbE SFP+
vmnic7  0000:83:00.1  i40en   Up            Up           10000  Full    6c:fe:54:34:b7:91  1500  Intel(R) Ethernet Controller X710 for 10GbE SFP+

Switch Interconnects:

swt05 - server connectivity

Code:
swt05# show running-config interface ethernet 1/24

interface Ethernet1/24
  description TRUNK - esx01
  switchport
  switchport mode trunk
  switchport trunk allowed vlan 300,310,350,360-364
  mtu 9216
  no shutdown

swt05# show running-config interface ethernet 1/26

interface Ethernet1/26
  description TRUNK - Port-Channel26 - pve03
  switchport
  switchport mode trunk
  switchport trunk allowed vlan 300,310,350,360-364
  mtu 9216
  channel-group 26 mode active
  no shutdown

swt05# show running-config interface port-channel 26

interface port-channel26
  description TRUNK - pve03
  switchport
  switchport mode trunk
  switchport trunk allowed vlan 300,310,350,360-364
  mtu 9216
  vpc 26

swt05# show interface ethernet 1/24 | i MTU
  MTU 9216 bytes, BW 10000000 Kbit , DLY 10 usec
swt05# show interface ethernet 1/26 | i MTU
  MTU 9216 bytes, BW 10000000 Kbit , DLY 10 usec
swt05# show interface port-channel 26 | i MTU
  MTU 9216 bytes, BW 10000000 Kbit , DLY 10 usec

swt06 - server connectivity

Code:
swt06# show running-config interface ethernet 1/24

interface Ethernet1/24
  description TRUNK - esx01
  switchport
  switchport mode trunk
  switchport trunk allowed vlan 300,310,350,360-364
  mtu 9216
  no shutdown

swt06# show running-config interface ethernet 1/26

interface Ethernet1/26
  description TRUNK - Port-Channel26 - pve03
  switchport
  switchport mode trunk
  switchport trunk allowed vlan 300,310,350,360-364
  mtu 9216
  channel-group 26 mode active
  no shutdown

swt06# show running-config interface port-channel 26

interface port-channel26
  description TRUNK - pve03
  switchport
  switchport mode trunk
  switchport trunk allowed vlan 300,310,350,360-364
  mtu 9216
  vpc 26

swt06# show interface ethernet 1/24 | i MTU
  MTU 9216 bytes, BW 10000000 Kbit , DLY 10 usec
swt06# show interface ethernet 1/26 | i MTU
  MTU 9216 bytes, BW 10000000 Kbit , DLY 10 usec
swt06# show interface port-channel 26 | i MTU
  MTU 9216 bytes, BW 10000000 Kbit , DLY 10 usec

switch MLAG (vPC) connectivity

swt05

Code:
swt05# show running-config interface port-channel 1

interface port-channel1
  switchport
  switchport mode trunk
  spanning-tree port type network
  vpc peer-link

swt05# show running-config interface ethernet 1/49-50

interface Ethernet1/49
  description vPC Link
  switchport
  switchport mode trunk
  channel-group 1 mode active
  no shutdown

interface Ethernet1/50
  description vPC Link
  switchport
  switchport mode trunk
  channel-group 1 mode active
  no shutdown

swt05# show interface ethernet 1/49 | i MTU
  MTU 9216 bytes, BW 100000000 Kbit , DLY 10 usec
swt05# show interface ethernet 1/50 | i MTU
  MTU 9216 bytes, BW 100000000 Kbit , DLY 10 usec
swt05# show interface port-channel 1 | i MTU
  MTU 9216 bytes, BW 200000000 Kbit , DLY 10 usec

swt06

Code:
swt06# show running-config interface port-channel 1

interface port-channel1
  switchport
  switchport mode trunk
  spanning-tree port type network
  vpc peer-link

swt06# show running-config interface ethernet 1/49

interface Ethernet1/49
  description vPC Link
  switchport
  switchport mode trunk
  channel-group 1 mode active
  no shutdown

swt06# show running-config interface ethernet 1/50

interface Ethernet1/50
  description vPC Link
  switchport
  switchport mode trunk
  channel-group 1 mode active
  no shutdown

swt06# show interface port-channel 1 | i MTU
  MTU 9216 bytes, BW 200000000 Kbit , DLY 10 usec
swt06# show interface ethernet 1/49 | i MTU
  MTU 9216 bytes, BW 100000000 Kbit , DLY 10 usec
swt06# show interface ethernet 1/50 | i MTU
  MTU 9216 bytes, BW 100000000 Kbit , DLY 10 usec

Connectivity diagram for servers
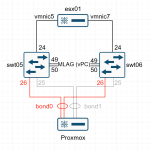
1749562266915.png

Some MTU testing between hosts:

esx01 -> pve03

Code:
[root@esx01:~] ping -d -s 1472 10.210.10.112
PING 10.210.10.112 (10.210.10.112): 1472 data bytes
1480 bytes from 10.210.10.112: icmp_seq=0 ttl=64 time=0.150 ms
1480 bytes from 10.210.10.112: icmp_seq=1 ttl=64 time=0.138 ms
1480 bytes from 10.210.10.112: icmp_seq=2 ttl=64 time=0.164 ms

--- 10.210.10.112 ping statistics ---
3 packets transmitted, 3 packets received, 0% packet loss
round-trip min/avg/max = 0.138/0.151/0.164 ms

[root@esx01:~] ping -d -s 1473 10.210.10.112
PING 10.210.10.112 (10.210.10.112): 1473 data bytes
sendto() failed (Message too long)

--- 10.210.10.112 ping statistics ---
3 packets transmitted, 0 packets received, 100% packet loss

pve03 -> esx01

Code:
root@pve03:~# ping -M do -s 1472 10.210.10.111
PING 10.210.10.111 (10.210.10.111) 1472(1500) bytes of data.
1480 bytes from 10.210.10.111: icmp_seq=1 ttl=64 time=0.136 ms
1480 bytes from 10.210.10.111: icmp_seq=2 ttl=64 time=0.148 ms
1480 bytes from 10.210.10.111: icmp_seq=3 ttl=64 time=0.102 ms
^C
--- 10.210.10.111 ping statistics ---
3 packets transmitted, 3 received, 0% packet loss, time 2051ms
rtt min/avg/max/mdev = 0.102/0.128/0.148/0.019 ms
root@pve03:~# ping -M do -s 1473 10.210.10.111
PING 10.210.10.111 (10.210.10.111) 1473(1501) bytes of data.
ping: local error: message too long, mtu=1500
^C
--- 10.210.10.111 ping statistics ---
4 packets transmitted, 0 received, +4 errors, 100% packet loss, time 3094ms

Workstation - my workstation (172.30.32.19) is 5 hops from the servers.

workstation -> pve03

Code:
PS C:\> ping -f -l 1472 10.210.10.111

Pinging 10.210.10.111 with 1472 bytes of data:
Reply from 10.210.10.111: bytes=1472 time=3ms TTL=60
Reply from 10.210.10.111: bytes=1472 time=4ms TTL=60
Reply from 10.210.10.111: bytes=1472 time=2ms TTL=60
Reply from 10.210.10.111: bytes=1472 time=6ms TTL=60

Ping statistics for 10.210.10.111:
    Packets: Sent = 4, Received = 4, Lost = 0 (0% loss),
Approximate round trip times in milli-seconds:
    Minimum = 2ms, Maximum = 6ms, Average = 3ms
PS C:\> ping -f -l 1473 10.210.10.111

Pinging 10.210.10.111 with 1473 bytes of data:
Packet needs to be fragmented but DF set.

Ping statistics for 10.210.10.111:
    Packets: Sent = 4, Received = 0, Lost = 4 (100% loss),

Due to firewall rules on the workstation (which I can't modify), the server can't ping the workstation however we can at least try.

pve03 -> workstation

Code:
root@pve03:~# ping -M do -s 1472 -c 3 -W 1 172.30.32.19
PING 172.30.32.19 (172.30.32.19) 1472(1500) bytes of data.

--- 172.30.32.19 ping statistics ---
3 packets transmitted, 0 received, 100% packet loss, time 2079ms

root@pve03:~# ping -M do -s 1473 -c 3 -W 1 172.30.32.19
PING 172.30.32.19 (172.30.32.19) 1473(1501) bytes of data.
ping: local error: message too long, mtu=1500

--- 172.30.32.19 ping statistics ---
3 packets transmitted, 0 received, +3 errors, 100% packet loss, time 2077ms

I can however reach my workstations first hop from pve03

Code:
root@pve03:~# ping -M do -s 1472 -c 3 -W 1 172.30.32.1
PING 172.30.32.1 (172.30.32.1) 1472(1500) bytes of data.
1480 bytes from 172.30.32.1: icmp_seq=1 ttl=61 time=1.02 ms
1480 bytes from 172.30.32.1: icmp_seq=2 ttl=61 time=0.960 ms
1480 bytes from 172.30.32.1: icmp_seq=3 ttl=61 time=0.964 ms

--- 172.30.32.1 ping statistics ---
3 packets transmitted, 3 received, 0% packet loss, time 2002ms
rtt min/avg/max/mdev = 0.960/0.981/1.019/0.026 ms
root@pve03:~# ping -M do -s 1473 -c 3 -W 1 172.30.32.1
PING 172.30.32.1 (172.30.32.1) 1473(1501) bytes of data.
ping: local error: message too long, mtu=1500

--- 172.30.32.1 ping statistics ---
3 packets transmitted, 0 received, +3 errors, 100% packet loss, time 2075ms
 
Last edited:
Does the proxmox webUI have a timeout due to a task (e.g. querying the ESXi storage) taking too long?

If I do a bit of additional checking:

Let's ask how many VMs there are using VMWare PowerCLI (ignoring the vCLS VMs)

Code:
PS C:\> Connect-ViServer 10.210.10.111
PS C:\> (Get-VM | Where-Object { $_.Name -notlike "vcls*" } | Measure-Object).Count
410

Now let's ask the listvms script the same (it skips vCLS automatically):

Code:
root@pve03:/usr/libexec/pve-esxi-import-tools# ./listvms.py --skip-cert-verification 10.210.10.111 root esx01.pw | jq ' [ ."ha-datacenter".vms[] ] | length '
Skipping vCLS agent VM: vCLS-f83e5741-60e2-4f39-9b55-b0aaf8569b89
Skipping vCLS agent VM: vCLS-e263bbb6-9c9e-4d3f-aacb-c6fcda8f6698
410

Both commands agree there are 410 VMs on the host.

Now I will try to add the storage -> ESXi (NOTE: I removed the original, adding it again as esx-dev01)

I get the same errors as originally reported, but looking in the directory for the ESXi storage:

Code:
root@pve03:/usr/libexec/pve-esxi-import-tools# ls /run/pve/import/esxi/esx-dev01/mnt/ha-datacenter/CONTENT | wc -l
410

Do the disks match?

What does PowerCLI say?

Code:
PS C:\> (Get-VM | Where-Object { $_.Name -notlike "vcls*" } | Get-Harddisk | Measure-Object).Count
438

What about listvms?

Code:
root@pve03:/usr/libexec/pve-esxi-import-tools# ./listvms.py --skip-cert-verification 10.210.10.111 root esx01.pw | jq ' [ ."ha-datacenter".vms[].disks | length ] | add '
Skipping vCLS agent VM: vCLS-f83e5741-60e2-4f39-9b55-b0aaf8569b89
Skipping vCLS agent VM: vCLS-e263bbb6-9c9e-4d3f-aacb-c6fcda8f6698
438

How many vmdk files listed in the folder?

Code:
root@pve03:/usr/libexec/pve-esxi-import-tools# find /run/pve/import/esxi/esx-dev01/mnt/ha-datacenter/CONTENT/ | grep vmdk | wc -l
438

Everything looks to be functioning, with the exception of the webUI throwing the timeout error.
 
Add time measuring to your commands, do they hover around any noticeable round number?
Try to add the storage from CLI ( man pvesm ), do you get the same error? Anything in the log? You can either get a network trace or expand the CLI with debug, ie modify the python file.


Blockbridge : Ultra low latency all-NVME shared storage for Proxmox - https://www.blockbridge.com/proxmox
 
Timing:

Running listvms is pretty consistent at around 30 seconds.

Code:
root@pve03:/usr/libexec/pve-esxi-import-tools# time /usr/libexec/pve-esxi-import-tools/listvms.py --skip-cert-verification 10.210.10.111 root /etc/pve/priv/storage/esx-dev02.pw 2>&1 >/dev/null

real    0m29.671s
user    0m22.537s
sys     0m0.391s
root@pve03:/usr/libexec/pve-esxi-import-tools# time /usr/libexec/pve-esxi-import-tools/listvms.py --skip-cert-verification 10.210.10.111 root /etc/pve/priv/storage/esx-dev02.pw &>/dev/null

real    0m30.262s
user    0m23.106s
sys     0m0.404s
root@pve03:/usr/libexec/pve-esxi-import-tools# time /usr/libexec/pve-esxi-import-tools/listvms.py --skip-cert-verification 10.210.10.111 root /etc/pve/priv/storage/esx-dev02.pw &>/dev/null

real    0m29.850s
user    0m22.757s
sys     0m0.353s

running pvesm list esx-dev02 will vary from 30 seconds to 0.7xx seconds

Code:
root@pve03:/usr/libexec/pve-esxi-import-tools# time pvesm list esx-dev02 &>/dev/null

real    0m0.723s
user    0m0.624s
sys     0m0.092s
root@pve03:/usr/libexec/pve-esxi-import-tools# time pvesm list esx-dev02 &>/dev/null

real    0m0.706s
user    0m0.633s
sys     0m0.067s
root@pve03:/usr/libexec/pve-esxi-import-tools# time pvesm list esx-dev02 &>/dev/null

real    0m30.790s
user    0m23.572s
sys     0m0.474s
root@pve03:/usr/libexec/pve-esxi-import-tools# time pvesm list esx-dev02 &>/dev/null

real    0m0.723s
user    0m0.648s
sys     0m0.068s
root@pve03:/usr/libexec/pve-esxi-import-tools# time pvesm list esx-dev02 &>/dev/null

real    0m0.725s
user    0m0.654s
sys     0m0.066s

I'm taking a guess with regards to the time differences for above. My assumption is that the proxmox is monitoring for storage updates on the ESXi host, and only runs listvms when an update occurs? VMware vCenter API Performance Best Practices
mentions a WaitForUpdatesEx method which I'm guessing might be used somewhere, as I do see periodic traffic between proxmox and ESXi once the storage has been added.. NOTE: This host is not 'static', there are (potentially constant) changes occurring on the ESXi device (e.g. VM cloning, removal, etc).

What if I try adding it with the pvesm command? It isn't fast, but is always successful.

Code:
root@pve03:/usr/libexec/pve-esxi-import-tools# pvesm remove esx-dev02; time pvesm add esxi esx-dev02 --server 10.210.10.111 --username root --password "XXXXXXXX" --skip-cert-verification true &>/dev/null

real    0m50.778s
user    0m23.432s
sys     0m0.414s
root@pve03:/usr/libexec/pve-esxi-import-tools# pvesm remove esx-dev02; time pvesm add esxi esx-dev02 --server 10.210.10.111 --username root --password "XXXXXXXX" --skip-cert-verification true &>/dev/null

real    0m49.859s
user    0m23.382s
sys     0m0.488s
root@pve03:/usr/libexec/pve-esxi-import-tools# pvesm remove esx-dev02; time pvesm add esxi esx-dev02 --server 10.210.10.111 --username root --password "XXXXXXXX" --skip-cert-verification true &>/dev/null

real    0m52.078s
user    0m23.297s
sys     0m0.436s

If I run tcpdump-uw -i vmk0 host 10.210.10.112 on the ESXi host while adding the storage, there is network traffic between ESXi and proxmox the entire time the pvesm add command is running.

What about performance on the network side? ESXi has iperf available, let's try a throughput test.

NOTE: You have to make a copy of iperf for it to run.

Code:
[root@esx01:~] /usr/lib/vmware/vsan/bin/iperf3.copy -s -B 10.210.10.111
-----------------------------------------------------------
Server listening on 5201 (test #1)
-----------------------------------------------------------

Have proxmox be the client.

Code:
root@pve03:~# iperf3 -c 10.210.10.111
Connecting to host 10.210.10.111, port 5201
[  5] local 10.210.10.112 port 51330 connected to 10.210.10.111 port 5201
[ ID] Interval           Transfer     Bitrate         Retr  Cwnd
[  5]   0.00-1.00   sec  1.05 GBytes  9.02 Gbits/sec    0   1.35 MBytes
[  5]   1.00-2.00   sec  1.09 GBytes  9.39 Gbits/sec    0   1.35 MBytes
[  5]   2.00-3.00   sec  1.09 GBytes  9.36 Gbits/sec    0   1.82 MBytes
[  5]   3.00-4.00   sec  1.09 GBytes  9.39 Gbits/sec    0   1.82 MBytes
[  5]   4.00-5.00   sec  1.09 GBytes  9.39 Gbits/sec    0   1.82 MBytes
[  5]   5.00-6.00   sec  1.09 GBytes  9.39 Gbits/sec    0   1.92 MBytes
[  5]   6.00-7.00   sec  1.09 GBytes  9.39 Gbits/sec    0   1.92 MBytes
[  5]   7.00-8.00   sec  1.09 GBytes  9.39 Gbits/sec    0   1.92 MBytes
[  5]   8.00-9.00   sec  1.09 GBytes  9.39 Gbits/sec    0   1.92 MBytes
[  5]   9.00-10.00  sec  1.09 GBytes  9.39 Gbits/sec    0   1.92 MBytes
- - - - - - - - - - - - - - - - - - - - - - - - -
[ ID] Interval           Transfer     Bitrate         Retr
[  5]   0.00-10.00  sec  10.9 GBytes  9.35 Gbits/sec    0             sender
[  5]   0.00-10.00  sec  10.9 GBytes  9.35 Gbits/sec                  receiver

iperf Done.

I did modify a copy of listvms to get some timing using python's time.perf_counter() call (minimal sample output below).

Code:
connect_to_esxi_host took 0.0603409000323154
list_vms took 0.03503443399677053
        get_vm_vmx_info took  0.021896929014474154
        get_vm_disk_info took  0.007328665000386536
fetch_and_update_vm_data( VMName01 ) took 0.05062682501738891
        get_vm_vmx_info took  0.023575578001327813
        get_vm_disk_info took  0.007742648012936115
fetch_and_update_vm_data( VMName02 ) took 0.05244935199152678
        get_vm_vmx_info took  0.021413003036286682
        get_vm_disk_info took  0.007081880001351237
fetch_and_update_vm_data( VMName03 ) took 0.0485370330279693

The qm import command seems (a single test import worked) to be working from the CLI. I only seem to be having issues in the webUI.
 
Update...

You can indirectly call this a network issue. After more digging, the listvms.py script is making multiple calls per VM to the VMWare API. In my case, 412 VMs (414 total, but two are vCLS which basically get ignored) typically takes 30 seconds to complete when run via the CLI. In the webUI this is causing a timeout 'somewhere' (I don't know where, nor have I tried to find it)...

I updated the script to use some other features of the VMWare API. Time differences can be seen below, and in my case (which is limited) I get the same results. I'll look at sharing the code back to the project once I figure out the process for that.

Code:
root@pve03:/usr/libexec/pve-esxi-import-tools# time /usr/libexec/pve-esxi-import-tools/listvms.py --skip-cert-verification 10.210.10.111 root /etc/pve/priv/storage/esx-dev01.pw  > /tmp/listvms.json
Skipping vCLS agent VM: vCLS-f83e5741-60e2-4f39-9b55-b0aaf8569b89
Skipping vCLS agent VM: vCLS-e263bbb6-9c9e-4d3f-aacb-c6fcda8f6698

real    0m31.507s
user    0m24.505s
sys     0m0.389s
root@pve03:/usr/libexec/pve-esxi-import-tools# time /usr/libexec/pve-esxi-import-tools/listvms-spec.py --skip-cert
-verification 10.210.10.111 root /etc/pve/priv/storage/esx-dev01.pw > /tmp/listvms-spec.json
Skipping vCLS agent VM: vCLS-f83e5741-60e2-4f39-9b55-b0aaf8569b89
Skipping vCLS agent VM: vCLS-e263bbb6-9c9e-4d3f-aacb-c6fcda8f6698

real    0m4.209s
user    0m2.980s
sys     0m0.127s
root@pve03:/usr/libexec/pve-esxi-import-tools# diff <(jq --sort-keys . /tmp/listvms.json) <(jq --sort-keys . /tmp/listvms-spec.json)

I'm wondering if others could share some info regarding performance? I don't think it has anything to do with the physical network or hosts, just too many calls to a network API. Some comparisons would be nice though.