Hi,
I have done some test on local lvm, on 1 intel s3610 sata drive
4k randwrite with fio on host && guest windows2019 with virtio-scsi and default options
(I have also tested with crystalmark, I have almost same result than fio)
host result
---------------
fio --time_based --name=benchmark --size=5G --runtime=30 --filename=/dev/pve/vm-1705-disk-0 --direct=1 --ioengine=libaio --numjobs=X --iodepth=X --rw=randwrite --blocksize=4k --group_reporting
iodepth=8,numjob=8
bw=208477KB/s, iops=52119,
iodepth=32,numjob=1
bw=237537KB/s, iops=59384
iodepth=1,numjob=1
bw=69831KB/s, iops=17457
windows 2019 result
------------------------------
fio.exe --time_based --name=benchmark --size=5G --runtime=30 --filename=\\.\PhysicalDrive2 --ioengine=windowsaio --numjobs=X --iodepth=X --rw=randwrite --blocksize=4k --group_reporting
thread8,iodepth=8
write: IOPS=59.9k, BW=234MiB/s
thread1, iodepth=32
IOPS=59.5k, BW=232MiB/s
thread1,iodepth=1
write : IOPS=9224, BW=36.0MiB/s
So, it's almost the same for with big iodepth, and twice slower with iodepth=1 (expected with virtulization overhead)
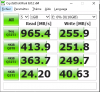
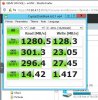
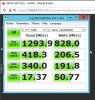
I have attached crystalmark results too.
(I'm using 3,2ghz intel cpu, I think it can also help for low iodepth)