Hello
I've had one Proxmox host which only hosts one VM which keeps locking up. As I recently just upgraded my other Proxmox hosts to version 8.1.3 I did the same with the hope that would solve it. It sadly did not. The host feels very sluggish after a few hours of uptime
In the console I see following errors:

I've found other threads with similar issues when using NFS. I triggered a backup yesterday to my NFS share. This is the first time a NFS share is mounted to the Proxmox host.
The journalctl logs output following more detailed information:
Proxmox version information:
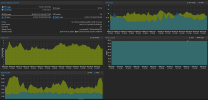
The NUC has 64Gb memory and I've assigned 60Gb to that host. The proxmox summary dashboard looks as follows:
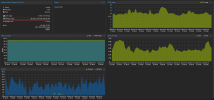
And the host summary dashboard:
The host which runs ubuntu was also updated yesterday. Does anyone have any clue what I should try to solve this lockup?
Thanks!
I've had one Proxmox host which only hosts one VM which keeps locking up. As I recently just upgraded my other Proxmox hosts to version 8.1.3 I did the same with the hope that would solve it. It sadly did not. The host feels very sluggish after a few hours of uptime
In the console I see following errors:

I've found other threads with similar issues when using NFS. I triggered a backup yesterday to my NFS share. This is the first time a NFS share is mounted to the Proxmox host.
The journalctl logs output following more detailed information:
C-like:
Jan 07 03:30:01 docker-host-01 CRON[288755]: pam_unix(cron:session): session closed for user root
Jan 07 03:34:51 docker-host-01 systemd[1]: run-docker-runtime\x2drunc-moby-3e0447840889bb4d0303f9753e9c30d795633a32e57b21fc9359600c3edb367c-runc.WJR1c6.mount: Deactivated successfully.
Jan 07 03:43:41 docker-host-01 dockerd[39354]: time="2024-01-07T03:43:40.765991831Z" level=error msg="stream copy error: reading from a closed fifo"
Jan 07 03:43:41 docker-host-01 dockerd[39354]: time="2024-01-07T03:43:40.765994427Z" level=error msg="stream copy error: reading from a closed fifo"
Jan 07 03:44:47 docker-host-01 kernel: watchdog: BUG: soft lockup - CPU#5 stuck for 40s! [kworker/5:1:292175]
Jan 07 03:44:47 docker-host-01 kernel: watchdog: BUG: soft lockup - CPU#14 stuck for 22s! [kworker/u32:4:292750]
Jan 07 03:44:47 docker-host-01 kernel: rcu: INFO: rcu_preempt detected stalls on CPUs/tasks:
Jan 07 03:44:47 docker-host-01 kernel: rcu:         5-...0: (1 GPs behind) idle=547/1/0x4000000000000000 softirq=2785273/2785274 fqs=5947
Jan 07 03:44:47 docker-host-01 kernel:         (detected by 9, t=15002 jiffies, g=4773745, q=2553)
Jan 07 03:44:47 docker-host-01 kernel: Sending NMI from CPU 9 to CPUs 5:
Jan 07 03:44:47 docker-host-01 kernel: NMI backtrace for cpu 5
Jan 07 03:44:47 docker-host-01 kernel: rcu: rcu_preempt kthread timer wakeup didn't happen for 2629 jiffies! g4773745 f0x0 RCU_GP_WAIT_FQS(5) ->state=0x402
Jan 07 03:44:47 docker-host-01 kernel: rcu:         Possible timer handling issue on cpu=10 timer-softirq=302674
Jan 07 03:44:47 docker-host-01 kernel: rcu: rcu_preempt kthread starved for 2630 jiffies! g4773745 f0x0 RCU_GP_WAIT_FQS(5) ->state=0x402 ->cpu=10
Jan 07 03:44:47 docker-host-01 kernel: rcu:         Unless rcu_preempt kthread gets sufficient CPU time, OOM is now expected behavior.
Jan 07 03:44:47 docker-host-01 kernel: rcu: RCU grace-period kthread stack dump:
Jan 07 03:44:47 docker-host-01 kernel: task:rcu_preempt     state:I stack:    0 pid:   15 ppid:     2 flags:0x00004000
Jan 07 03:44:47 docker-host-01 kernel: rcu: Stack dump where RCU GP kthread last ran:
Jan 07 03:44:47 docker-host-01 kernel: Sending NMI from CPU 9 to CPUs 10:
Jan 07 03:44:47 docker-host-01 kernel: NMI backtrace for cpu 10
Jan 07 03:44:47 docker-host-01 kernel: CPU: 10 PID: 0 Comm: swapper/10 Tainted: G           OE     5.17.0-1019-oem #20-Ubuntu
Jan 07 03:44:47 docker-host-01 kernel: Hardware name: QEMU Standard PC (i440FX + PIIX, 1996), BIOS rel-1.16.2-0-gea1b7a073390-prebuilt.qemu.org 04/01/2014
Jan 07 03:44:47 docker-host-01 kernel: RIP: 0010:ioread8+0x2e/0x70
Jan 07 03:44:47 docker-host-01 kernel:  floppy
Jan 07 03:44:47 docker-host-01 kernel:  crypto_simd cryptd drm psmouse video
Jan 07 03:44:47 docker-host-01 kernel: CPU: 5 PID: 292175 Comm: kworker/5:1 Tainted: G           OE     5.17.0-1019-oem #20-Ubuntu
Jan 07 03:44:47 docker-host-01 kernel:  failover virtio_scsi
Jan 07 03:44:47 docker-host-01 kernel: Hardware name: QEMU Standard PC (i440FX + PIIX, 1996), BIOS rel-1.16.2-0-gea1b7a073390-prebuilt.qemu.org 04/01/2014
Jan 07 03:44:47 docker-host-01 kernel:  i2c_piix4 pata_acpi floppy
Jan 07 03:44:47 docker-host-01 kernel: CPU: 14 PID: 292750 Comm: kworker/u32:4 Tainted: G           OE     5.17.0-1019-oem #20-Ubuntu
Jan 07 03:44:47 docker-host-01 kernel: Workqueue: pm pm_runtime_work
Jan 07 03:44:47 docker-host-01 kernel: Hardware name: QEMU Standard PC (i440FX + PIIX, 1996), BIOS rel-1.16.2-0-gea1b7a073390-prebuilt.qemu.org 04/01/2014
Jan 07 03:44:47 docker-host-01 dockerd[39354]: time="2024-01-07T03:43:40.766029022Z" level=error msg="stream copy error: reading from a closed fifo"
Jan 07 03:44:47 docker-host-01 dockerd[39354]: time="2024-01-07T03:43:40.766034767Z" level=error msg="stream copy error: reading from a closed fifo"
Jan 07 03:44:47 docker-host-01 dockerd[39354]: time="2024-01-07T03:43:41.324414945Z" level=warning msg="Health check for container 3e0447840889bb4d0303f9753e9c30d795633a32e57b21fc9359600c3edb367c error: timed out starting health check for container 3e0447840889bb4d0303f9753e9c30d795>Jan 07 03:44:47 docker-host-01 dockerd[39354]: time="2024-01-07T03:43:41.324414535Z" level=warning msg="Health check for container 7a1c027c61aaf0ac9a245a2daf69fdfb33b97e79ceeba9bdeec4cf59c1d04ab6 error: timed out starting health check for container 7a1c027c61aaf0ac9a245a2daf69fdfb33>Jan 07 03:45:16 docker-host-01 systemd[1]: run-docker-runtime\x2drunc-moby-3e0447840889bb4d0303f9753e9c30d795633a32e57b21fc9359600c3edb367c-runc.LHEJ53.mount: Deactivated successfully.
Jan 07 03:48:18 docker-host-01 systemd[1]: run-docker-runtime\x2drunc-moby-7a1c027c61aaf0ac9a245a2daf69fdfb33b97e79ceeba9bdeec4cf59c1d04ab6-runc.2xWGWn.mount: Deactivated successfully.
Jan 07 03:59:58 docker-host-01 systemd[1]: run-docker-runtime\x2drunc-moby-3e0447840889bb4d0303f9753e9c30d795633a32e57b21fc9359600c3edb367c-runc.2lfvzY.mount: Deactivated successfully.
Jan 07 04:00:58 docker-host-01 systemd[1]: run-docker-runtime\x2drunc-moby-3e0447840889bb4d0303f9753e9c30d795633a32e57b21fc9359600c3edb367c-runc.795z15.mount: Deactivated successfully.
Proxmox version information:
C-like:
root@proxmox:~# pveversion -v
proxmox-ve: 8.1.0 (running kernel: 6.5.11-7-pve)
pve-manager: 8.1.3 (running version: 8.1.3/b46aac3b42da5d15)
proxmox-kernel-helper: 8.1.0
pve-kernel-5.15: 7.4-9
proxmox-kernel-6.5: 6.5.11-7
proxmox-kernel-6.5.11-7-pve-signed: 6.5.11-7
pve-kernel-5.15.131-2-pve: 5.15.131-3
pve-kernel-5.15.30-2-pve: 5.15.30-3
ceph-fuse: 16.2.11+ds-2
corosync: 3.1.7-pve3
criu: 3.17.1-2
glusterfs-client: 10.3-5
ifupdown2: 3.2.0-1+pmx7
ksm-control-daemon: 1.4-1
libjs-extjs: 7.0.0-4
libknet1: 1.28-pve1
libproxmox-acme-perl: 1.5.0
libproxmox-backup-qemu0: 1.4.1
libproxmox-rs-perl: 0.3.3
libpve-access-control: 8.0.7
libpve-apiclient-perl: 3.3.1
libpve-common-perl: 8.1.0
libpve-guest-common-perl: 5.0.6
libpve-http-server-perl: 5.0.5
libpve-network-perl: 0.9.5
libpve-rs-perl: 0.8.7
libpve-storage-perl: 8.0.5
libspice-server1: 0.15.1-1
lvm2: 2.03.16-2
lxc-pve: 5.0.2-4
lxcfs: 5.0.3-pve4
novnc-pve: 1.4.0-3
proxmox-backup-client: 3.1.2-1
proxmox-backup-file-restore: 3.1.2-1
proxmox-kernel-helper: 8.1.0
proxmox-mail-forward: 0.2.2
proxmox-mini-journalreader: 1.4.0
proxmox-offline-mirror-helper: 0.6.3
proxmox-widget-toolkit: 4.1.3
pve-cluster: 8.0.5
pve-container: 5.0.8
pve-docs: 8.1.3
pve-edk2-firmware: 4.2023.08-2
pve-firewall: 5.0.3
pve-firmware: 3.9-1
pve-ha-manager: 4.0.3
pve-i18n: 3.1.5
pve-qemu-kvm: 8.1.2-6
pve-xtermjs: 5.3.0-3
qemu-server: 8.0.10
smartmontools: 7.3-pve1
spiceterm: 3.3.0
The NUC has 64Gb memory and I've assigned 60Gb to that host. The proxmox summary dashboard looks as follows:

And the host summary dashboard:

The host which runs ubuntu was also updated yesterday. Does anyone have any clue what I should try to solve this lockup?
Thanks!


