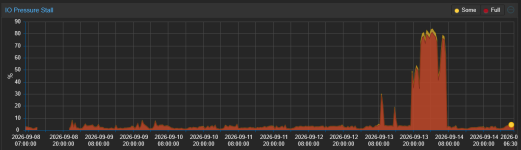
Update after another full backup cycle and a reboot to the latest Proxmox kernel.
The host is now running:
Proxmox VE 9.2
pve-manager 9.2.20
kernel 7.0.14-16-pve
Dell PowerVault ME5224
2x direct 25 GbE iSCSI
ALUA multipath
After the reboot, iscsi_tcp.recv_from_iscsi_q was back to its default value N.
I changed it to:
iscsi_tcp.recv_from_iscsi_q=Y
and then recreated both iSCSI sessions one path at a time, so both sessions were established after enabling the parameter.
Multipath was verified afterwards and remained healthy:
prio=50 status=active
sdk active ready running
prio=10 status=enabled
sdj active ready running
No other TCP/iSCSI tuning was changed for this test. In particular, tcp.window_size was left unchanged.
Immediately after the reboot and session recreation, the relevant TCP counters were all zero:
TcpExtTCPFromZeroWindowAdv 0
TcpExtTCPToZeroWindowAdv 0
TcpExtTCPWantZeroWindowAdv 0
After starting the VMs:
TcpExtTCPFromZeroWindowAdv 9
TcpExtTCPToZeroWindowAdv 5
TcpExtTCPWantZeroWindowAdv 5466
After the overnight PBS backup completed:
TcpExtTCPFromZeroWindowAdv 18
TcpExtTCPToZeroWindowAdv 10
TcpExtTCPWantZeroWindowAdv 868725
So during the backup window alone, TCPWantZeroWindowAdv increased by approximately 863k.
This is important because it shows that the TCP receive-window pressure is still clearly present under backup load. recv_from_iscsi_q=Y therefore does not appear to eliminate the underlying TCP window condition itself.
However, despite that large increase:
- the backup completed successfully
- there were no iSCSI NOP timeout events
- there were no iSCSI transport disconnects
- there were no session recovery events
- there were no SCSI or I/O errors
- multipath remained healthy for the entire backup
- our NOP/event watcher did not create any new event captures
The kernel log filter for NOP timeouts, connection/transport failures, session recovery, task aborts and SCSI/I/O errors returned no events.
There is one additional observation which may be relevant.
Our debugging periodically triggers SysRq blocked-task/all-CPU snapshots during high storage pressure. In one snapshot at 00:00:28, an iSCSI transmit worker was caught in D-state:
task:kworker/u259:3 state

Workqueue: iscsi_q_3 iscsi_xmitworker [libiscsi]
iscsi_xmit_task
schedule
At the same time, the receive side was running via the separate workqueue introduced by recv_from_iscsi_q=Y:
Workqueue: iscsi_q_3 iscsi_sw_tcp_recv_data_work [iscsi_tcp]
RIP: iscsi_tcp_segment_done
...
tcp_read_sock
iscsi_sw_tcp_recv_data_work
There were no kernel messages such as:
task ... blocked for more than X seconds
The phrase only appears in the grep command itself, not as an actual kernel warning.
So my current interpretation is:
iscsi_tcp.recv_from_iscsi_q=Y does not remove the TCP receive-window pressure, and transiently blocked iSCSI workers can still be observed under heavy backup load.
However, since enabling it and recreating the sessions, that condition has so far no longer developed into the previous long iSCSI stall / NOP timeout / transport disconnect.
We have now completed multiple backup cycles with recv_from_iscsi_q=Y without reproducing the original NOP timeout.
I will keep the current configuration unchanged and continue monitoring further backup cycles.