I have this very odd problem where at around 20 days plus of uptime on my host, the I/O delay exponentially (to about 50% plus) increases and ultimately I have no choice but to reboot the host itself, which isn't ideal. I have disabled SWAP on the host, which has improved things a little but the I/O is never this high until around 20 days of time (must times the I/O delay is less than 10% with all VMs running). I also reboot the VMs which helps for a little while but then the I/O delay spikes back up again (I am talking on the same day as rebooting the VMs). I am not sure how to resolve this as I have been trying to for a while now. Could I possibly get some help please?
Proxmox High I/O Delay
- Thread starter DanW369
- Start date
You are using an out of date browser. It may not display this or other websites correctly.
You should upgrade or use an alternative browser.
You should upgrade or use an alternative browser.
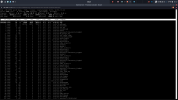
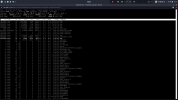
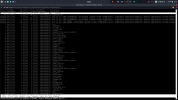
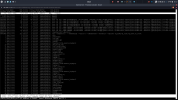
Can you check the processes, their CPU usage and their I/O?
For the first part you can use `top`, while for I/O you probably want to look at `iotop`.
How is memory usage before and after you see the high I/O delay?
Please also provide the output of
For the first part you can use `top`, while for I/O you probably want to look at `iotop`.
How is memory usage before and after you see the high I/O delay?
Please also provide the output of
pveversion -v.As can be seen it gets really bad.
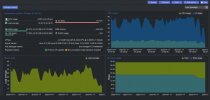
IOTOP moves and jumps so fast, its really hard to pinpoint what the issue is. I took these screenshots after I had already shut some VMs down and was shutting down others.
This is around 11GB of free memory and still misbehaving. At most times I am using around 24GB out of 32GB.
I don't get why when I reboot the host everything is perfectly fine. Then after about 20 - 30 days I/O delay spikes. I am running the same VMs all the time.
Attachments
pveversion -v
proxmox-ve: 7.2-1 (running kernel: 5.15.39-3-pve)
pve-manager: 7.2-7 (running version: 7.2-7/d0dd0e85)
pve-kernel-5.15: 7.2-8
pve-kernel-helper: 7.2-8
pve-kernel-5.13: 7.1-9
pve-kernel-5.11: 7.0-10
pve-kernel-5.15.39-3-pve: 5.15.39-3
pve-kernel-5.13.19-6-pve: 5.13.19-15
pve-kernel-5.13.19-1-pve: 5.13.19-3
pve-kernel-5.11.22-7-pve: 5.11.22-12
pve-kernel-5.11.22-4-pve: 5.11.22-9
ceph-fuse: 15.2.14-pve1
corosync: 3.1.5-pve2
criu: 3.15-1+pve-1
glusterfs-client: 9.2-1
ifupdown2: 3.1.0-1+pmx3
ksm-control-daemon: 1.4-1
libjs-extjs: 7.0.0-1
libknet1: 1.24-pve1
libproxmox-acme-perl: 1.4.2
libproxmox-backup-qemu0: 1.3.1-1
libpve-access-control: 7.2-4
libpve-apiclient-perl: 3.2-1
libpve-common-perl: 7.2-2
libpve-guest-common-perl: 4.1-2
libpve-http-server-perl: 4.1-3
libpve-storage-perl: 7.2-7
libspice-server1: 0.14.3-2.1
lvm2: 2.03.11-2.1
lxc-pve: 5.0.0-3
lxcfs: 4.0.12-pve1
novnc-pve: 1.3.0-3
proxmox-backup-client: 2.2.5-1
proxmox-backup-file-restore: 2.2.5-1
proxmox-mini-journalreader: 1.3-1
proxmox-widget-toolkit: 3.5.1
pve-cluster: 7.2-2
pve-container: 4.2-2
pve-docs: 7.2-2
pve-edk2-firmware: 3.20210831-2
pve-firewall: 4.2-5
pve-firmware: 3.5-1
pve-ha-manager: 3.4.0
pve-i18n: 2.7-2
pve-qemu-kvm: 6.2.0-11
pve-xtermjs: 4.16.0-1
qemu-server: 7.2-3
smartmontools: 7.2-pve3
spiceterm: 3.2-2
swtpm: 0.7.1~bpo11+1
vncterm: 1.7-1
zfsutils-linux: 2.1.5-pve1
Please provide information abouth the disks you're using, how your using them (single disk, RAID, ZFS).
Do you use a hardware RAID controller? If so, which one exactly?
Please also provide the output of
Do you use a hardware RAID controller? If so, which one exactly?
lspci -nnk shows the controller and the kernel driver in use.Please also provide the output of
lscpu and dmidecode -t biosI do not have any of my disks configured in a RAID / ZFS though I do have LVMs set up. I have a Dell 1TB HDD that came with my server, two Seagate Iron Wolfs at 4TB and one 6TB Western Digital Red. Two LVMs: one the 1TB disk and 1TB of the WD Red (which is partitioned) are a part of; and the two 4TB HDD are part of and other partition of the WD Red are a part of.
lscpu
Architecture: x86_64
CPU op-mode(s): 32-bit, 64-bit
Byte Order: Little Endian
Address sizes: 39 bits physical, 48 bits virtual
CPU(s): 4
On-line CPU(s) list: 0-3
Thread(s) per core: 1
Core(s) per socket: 4
Socket(s): 1
NUMA node(s): 1
Vendor ID: GenuineIntel
CPU family: 6
Model: 158
Model name: Intel(R) Xeon(R) E-2224 CPU @ 3.40GHz
Stepping: 10
CPU MHz: 3362.610
BogoMIPS: 6799.81
Virtualization: VT-x
L1d cache: 128 KiB
L1i cache: 128 KiB
L2 cache: 1 MiB
L3 cache: 8 MiB
NUMA node0 CPU(s): 0-3
Vulnerability Itlb multihit: KVM: Mitigation: Split huge pages
Vulnerability L1tf: Mitigation; PTE Inversion; VMX conditional cache flushes, SMT disabled
Vulnerability Mds: Mitigation; Clear CPU buffers; SMT disabled
Vulnerability Meltdown: Mitigation; PTI
Vulnerability Mmio stale data: Mitigation; Clear CPU buffers; SMT disabled
Vulnerability Retbleed: Mitigation; IBRS
Vulnerability Spec store bypass: Mitigation; Speculative Store Bypass disabled via prctl and seccomp
Vulnerability Spectre v1: Mitigation; usercopy/swapgs barriers and __user pointer sanitization
Vulnerability Spectre v2: Mitigation; IBRS, IBPB conditional, RSB filling
Vulnerability Srbds: Mitigation; Microcode
Vulnerability Tsx async abort: Mitigation; Clear CPU buffers; SMT disabled
Flags: fpu vme de pse tsc msr pae mce cx8 apic sep mtrr pge mca cmov pat pse36 clflush dts acpi mmx fxsr sse sse2 ss ht tm pbe syscall nx pdpe1gb rdtscp lm constant_tsc art arch_perfmon pebs bts rep_good nopl xtopology nonstop_tsc cpuid aperfmperf pni pclmulqdq dtes64 monitor ds_cpl vmx smx est tm2 ssse3 sdbg fma cx16 xtpr pdcm pcid sse4_1 sse4_2 x2apic movbe popcnt tsc_deadline_timer aes xsave avx f16c rdrand lahf_lm abm 3dnowprefetch cpuid_fault epb invpcid_single pti ssbd ibrs ibpb stibp tpr_shadow vnmi flexpriority ept vpid ept_ad fsgsbase tsc_adjust bmi1 hle avx2 smep bmi2 erms invpcid rtm mpx rdseed adx smap clflushopt intel_pt xsaveopt xsavec xgetbv1 xsaves dtherm ida arat pln pts md_clear flush_l1d
dmidecode -t bios
Getting SMBIOS data from sysfs.
SMBIOS 3.1 present.
Handle 0x0000, DMI type 0, 26 bytes
BIOS Information
Vendor: Dell Inc.
Version: 2.4.1
Release Date: 09/27/2018
Address: 0xF0000
Runtime Size: 64 kB
ROM Size: 32 MB
Characteristics:
ISA is supported
PCI is supported
PNP is supported
BIOS is upgradeable
BIOS shadowing is allowed
Boot from CD is supported
Selectable boot is supported
EDD is supported
Japanese floppy for Toshiba 1.2 MB is supported (int 13h)
5.25"/360 kB floppy services are supported (int 13h)
5.25"/1.2 MB floppy services are supported (int 13h)
3.5"/720 kB floppy services are supported (int 13h)
8042 keyboard services are supported (int 9h)
Serial services are supported (int 14h)
CGA/mono video services are supported (int 10h)
ACPI is supported
USB legacy is supported
BIOS boot specification is supported
Function key-initiated network boot is supported
Targeted content distribution is supported
UEFI is supported
BIOS Revision: 2.4
Handle 0x0D00, DMI type 13, 22 bytes
BIOS Language Information
Language Description Format: Long
Installable Languages: 1
en|US|iso8859-1
Currently Installed Language: en|US|iso8859-1
Are the disks connected to the mainboard directly or to a separate controller?
The BIOS seems to be older than the CPU you're using. Try updating it and see if the situation improves.
If you use a separate controller, please update its firmware as well.
The BIOS seems to be older than the CPU you're using. Try updating it and see if the situation improves.
If you use a separate controller, please update its firmware as well.
Processes generating I/O wait usually stay for some time in "D" state (uninterruptible sleep). When I/O wait is high, check which processes are in D state with something like:
for x in $(seq 1 1 20); do ps -eo state,pid,cmd | grep "^D"; echo "----"; sleep 5; done
Keep in mind that being in D state does not necessarily mean that such process is having I/O wait, but processes having I/O wait will be in D state.
Then, use lsof -p [PID] to find out which files are using those processes and track which storage(s) and disk(s) are suffering the I/O wait. Maybe some of your drives isnt behaving properly or is just dying.
The disks are connected to the mainboard. Thanks for the advice, I will look into the BIOS firmware. I have never actually upgraded BIOS firmware on Linux before, so I'll have to do some research....Are the disks connected to the mainboard directly or to a separate controller?
The BIOS seems to be older than the CPU you're using. Try updating it and see if the situation improves.
If you use a separate controller, please update its firmware as well.
Thank you I will check this out. I don't think any of my disks are failing as I do have SMARTCTL monitoring them but I will check it out.Processes generating I/O wait usually stay for some time in "D" state (uninterruptible sleep). When I/O wait is high, check which processes are in D state with something like:
for x in $(seq 1 1 20); do ps -eo state,pid,cmd | grep "^D"; echo "----"; sleep 5; done
Keep in mind that being in D state does not necessarily mean that such process is having I/O wait, but processes having I/O wait will be in D state.
Then, use lsof -p [PID] to find out which files are using those processes and track which storage(s) and disk(s) are suffering the I/O wait. Maybe some of your drives isnt behaving properly or is just dying.
So after about 40+ days, the IO Delay is back again. Running the commands as recommended by @VictorSTS for x in $(seq 1 1 20); do ps -eo state,pid,cmd | grep "^D"; echo "----"; sleep 5; done I see mainly these two processes recocurring:
D 704171 [kworker/u8:1+dm-thin]
D 3757240 [jbd2/dm-43-8]
Using the lsof commands shows the below results:
COMMAND PID USER FD TYPE DEVICE SIZE/OFF NODE NAME
kworker/u 704171 root cwd DIR 253,3 4096 2 /
kworker/u 704171 root rtd DIR 253,3 4096 2 /
kworker/u 704171 root txt unknown /proc/704171/exe
COMMAND PID USER FD TYPE DEVICE SIZE/OFF NODE NAME
jbd2/dm-4 3757240 root cwd DIR 253,3 4096 2 /
jbd2/dm-4 3757240 root rtd DIR 253,3 4096 2 /
jbd2/dm-4 3757240 root txt unknown /proc/3757240/exe
The only link I see there is the DEVICE ID (253, 3) which as it turns out appears to be my root disk. Could this possibly mean there is an issue with that disk and after a certain amount of days of running the server it just cannot handle the load on the disk? Any feedback or ideas would be appreciated, I am really trying to get down to the bottom of this issue.


