Hi everybody,
just came accross this weird behaviour of the Task List at the bottom in the GUI in a Proxmox 7.3-4 installation of 3 cluster nodes.
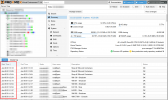
When opening it, it doesn't show current (or even shortly occured) tasks, but just tasks from many hours ago:

This Screenshot was taken today (2023-01-06) at 11:40. The entries in the Task List are starting at 01:13??
As a plus the Table is not sortable any more, clicking at the column headers just does nothing.
What is more:
When having the task list opened and trigger an arbitrary task (migrate a VM to another node for example), this new and running task is suddenly shown in the List (together with other shortly former ran tasks) but after a few seconds, the task lists again resets to the view shown in the screenshot above.
I was able to capture the responsible polling GET requests in Browsers dev-tools, when this happens:

--> This is the request when the list shortly is correct and showing the current running (and other shortyl former) tasks (in this example a VM migration), look at the "starttime" timestamp of the very first element in the JSON.
Just one polling request later, the same request only gives much older tasks (the ones starting from 01:13), not the current ones:

--> Notice the much older starttime timestamp of the very first element in the JSON response compared to the one in the screenshot above (16730011149 <-> 1672963989).
All this happens no matter on which of the three proxmox nodes in the 3-Node cluster one connects to and no matter which browser is used.
The server times are exactly the same with each other and the client pc used.
Any idea what is happening here?
Thx in advance for any hint.
just came accross this weird behaviour of the Task List at the bottom in the GUI in a Proxmox 7.3-4 installation of 3 cluster nodes.
When opening it, it doesn't show current (or even shortly occured) tasks, but just tasks from many hours ago:

This Screenshot was taken today (2023-01-06) at 11:40. The entries in the Task List are starting at 01:13??
As a plus the Table is not sortable any more, clicking at the column headers just does nothing.
What is more:
When having the task list opened and trigger an arbitrary task (migrate a VM to another node for example), this new and running task is suddenly shown in the List (together with other shortly former ran tasks) but after a few seconds, the task lists again resets to the view shown in the screenshot above.
I was able to capture the responsible polling GET requests in Browsers dev-tools, when this happens:

--> This is the request when the list shortly is correct and showing the current running (and other shortyl former) tasks (in this example a VM migration), look at the "starttime" timestamp of the very first element in the JSON.
Just one polling request later, the same request only gives much older tasks (the ones starting from 01:13), not the current ones:

--> Notice the much older starttime timestamp of the very first element in the JSON response compared to the one in the screenshot above (16730011149 <-> 1672963989).
All this happens no matter on which of the three proxmox nodes in the 3-Node cluster one connects to and no matter which browser is used.
The server times are exactly the same with each other and the client pc used.
Any idea what is happening here?
Thx in advance for any hint.
Attachments
Last edited:


