

Proxmox Datacenter Manager - Metrics Panels Showing No Nodes or Guests Available

rohli

New Member
Aug 7, 2023
2
0
0
Hi everyone,

I'm currently using Proxmox Datacenter Manager and noticed that the following metrics panels are not displaying any data:

  • Guests With the Highest CPU Usage - No guests available
  • Nodes With the Highest CPU Usage - No nodes available
  • Nodes With the Highest Memory Usage - No nodes available
1794201903415.png
Is this expected behavior, or could this indicate an issue with metrics collection?
Are there any specific configurations or requirements on the managed Proxmox VE nodes that need to be enabled for these panels to populate?

Has anyone experienced the same issue or found a solution?

Thanks in advance!
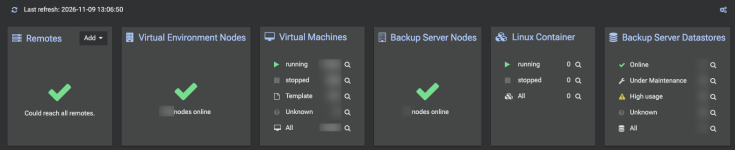
 
Only the panels are cropped in the screenshot, so the rest of the dashboard isn't visible. Are your remotes added, and do they show up as online in the remote overview with their nodes and guests listed? If they don't show there, the top-lists can't fill either.

If the remotes look fine, I'd check which token PDM uses on the PVE side. If you didn't let the wizard create it and used your own token with limited rights, it may lack the audit privileges (Sys.Audit / VM.Audit on /). The connection works then but no data comes back. Also, right after adding a remote it can take a few minutes before anything shows up.
Worth a look on the PDM host:
Code:
journalctl -u proxmox-datacenter-api -u proxmox-datacenter-privileged-api --since "1 hour ago"
Errors about metric collection or permission denied would show up there. Which PDM version are you on, and are the remotes single nodes or clusters?
 
Thanks for the suggestions.

Here's some additional information about our environment:

All remotes appear to be reachable in the Remote Overview, with nodes and guests successfully discovered.
Our environment consists of over 100 Proxmox VE nodes across multiple remotes, managing a large number of virtual machines.
All remotes are configured as multiple Proxmox VE clusters.

1794204495510.png

We are currently running:
  • Proxmox Datacenter Manager: 1.1.9
  • PDM Meta: 1.1.0
  • Kernel: 7.0.14-26-pve

We use the API token automatically created by the PDM setup wizard, with the Administrator role assigned. We haven't configured a custom token with limited privileges.


I checked the PDM logs using the suggested journalctl command and noticed recurring errors when requesting the metrics export endpoint:
Code:
client timed out on request /api2/extjs/cluster/metrics/export?history=1&local%2Donly=0&start%2Dtime=0, trying another remote

Could these metrics export timeouts be related to the empty top metrics panels?

Any suggestions on how to troubleshoot this further would be appreciated.
 
Yes, I'm pretty sure that's the cause. As far as I know the top lists come from the metrics PDM collects itself via that export endpoint, not from the live status in the overview. That's why remotes, nodes and guests look fine while the panels stay empty. start-time=0 is the first full pull with history. If it never succeeds, PDM probably never gets past that initial pull, and with 100+ nodes in total that can be a lot of data.

I'd run it by hand on one PVE node of an affected remote and time it:
Code:
time pvesh get /cluster/metrics/export --history 1 --local-only 0 --output-format json | wc -c
If that takes very long or the output is huge, you know where the problem is. Does it hit all remotes or only the big clusters? If a smaller cluster fills the panels and the large ones don't, it's a scaling issue. Report it on bugzilla.proxmox.com with the node count and timing. Also, which PVE version are the remotes on?