Proxmox and Zabbix supervision
- Thread starter lilp
- Start date
You are using an out of date browser. It may not display this or other websites correctly.
You should upgrade or use an alternative browser.
You should upgrade or use an alternative browser.
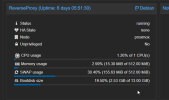
The first screenshot shows how busy the CPU is. (1.26%)I think information are false about VM and CT.
Zabbix looks at the classic "System Load". And Zabbix divides it "for reasons" by the number of CPUs - thus "Load average... (per CPU..."
The SysLoad is a drastically simplified single value to indicate the stress the system is under. It is calculated by the CPU percentage and especially also the IO-Queue length for disks (and the Interrupt handling, e.g. for the NICs). You can absolutely create a weird - and probably but not always problematic - situation with 1 percent CPU load and a System Load of 300 or more ;-)
In my personal world high SysLoad most often comes from slow storage. One of my data-Datastores (@home) uses rotating rust. During backup (which means reading the whole shebang) the System Load goes up to 35 - which in this case seems absolutely to be normal :-(
A better metric for the load of a Linux system is the "Pressure Stall Index": https://www.kernel.org/doc/html/latest/accounting/psi.html - but the problematic "SysLoad" nevertheless will stay for another while...
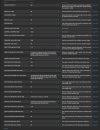
Above the Problems list there is a filter tab that you can use to show Operational data in the list. The problem you showed is configured to show the 1min, 5min and 15min load averages as operational data. Or, you can just see the separate item graphs for the 1min, 5min and 15min valueshow they behave.Where I can find thoses informations ?
Above it was already mentioned that CPU utilization and system load are not necessarily directly comparable. See the graphs created by the Linux template if they show more detailed view about the CPU load usage.


