Proxmox 8.2.2 Grafana Data Population

iflywhirlybirds

New Member
Jun 12, 2024
5
2
3
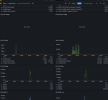
I apologize if this isnt the correct place for this but I wasnt sure where else to ask. Currently trying to set up Grafana with the native InfluxDB API in PM. I was able to get data to Influx, and I was able to see the buckets I created in Grafana, but for whatever reason, the servers are not showing up in any dashboard. I checked the variables in the dashboard and everything looks fine to me. It looks like all the dashboards I've tried are for PM 7+ and it got me thinking if either one of the variables changed, or if there is a setting I'm missing in Influx, or PM. Screenshot below. Thanks for the help.

Edit: Nodes not servers, there should be 4, and I can see them in Influx
 

Attachments

  • Screenshot 2024-07-03 133705.png
    Screenshot 2024-07-03 133705.png
    148.9 KB · Views: 14
Last edited:
I appreciate the response, I saw this on Reddit last night actually. What I ended up doing was removing the Stop: variable, and it came right up. So something obviouisly changed. I havent tried the above solution but I can tell you for sure that removing the
Code:
stop: v.timeRangeStop
got it working right away. Really curious what changed, I spent like 6 hours fighting this one

Try a new dashboard and remove the one I posted, I just tried it again to confirm and it works out of the box, data is flowing nicely and has been for almost 24 hours on my previous build
 
Last edited:
  • Like
Reactions: o0carter0o and UdoB
I appreciate the response, I saw this on Reddit last night actually. What I ended up doing was removing the Stop: variable, and it came right up. So something obviouisly changed. I havent tried the above solution but I can tell you for sure that removing the
Code:
stop: v.timeRangeStop
, got it working right away. Really curious what changed, I spent like 6 hours fighting this one
Well crap , That did trick! Thanks dude!
 
I appreciate the response, I saw this on Reddit last night actually. What I ended up doing was removing the Stop: variable, and it came right up. So something obviouisly changed. I havent tried the above solution but I can tell you for sure that removing the
Code:
stop: v.timeRangeStop
got it working right away. Really curious what changed, I spent like 6 hours fighting this one

Try a new dashboard and remove the one I posted, I just tried it again to confirm and it works out of the box, data is flowing nicely and has been for almost 24 hours on my previous build
this did it for me!

still don't get proper LXC CPU/memory usage, though....
 
everything except these 2 graphs (LXC CPU usage & LXC memory usage) is working perfectly.

granted, this is my first time setting up grafana so i'm happy with what i have but would be really cool to figure out how to get these working too.

edit:
interestingly, there is only "no data" when "all" servers are selected. i found that when i select only one server, it populates the graphs.

edit again:
i figured it out. i compared the query of the VM CPU usage and found that the nodename wasn't working correctly

i edited the LXC CPU & LXC memory usage query as follows:
replace this
Code:
  |> filter(fn: (r) => r["nodename"] == "${server}")
with this
Code:
  |> filter(fn: (r) => r["nodename"] =~ /${server:regex}/)
 

Attachments

  • grafana.png
    grafana.png
    159.6 KB · Views: 15
Last edited:
Hi all,

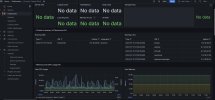
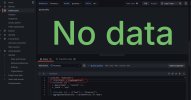
Im also having the same issue as you. Not sure if you have the same, but as you can see few pannels can be seen and few others not.
Im trying to remove the sentence stop: v.timeRangeStop and nothing happens. Still not being able to see data. Not sure if Im removing it from the right location.

It's my first time with Grafana, so sorry if Im doing something stupid:)
Captura2.JPGCaptura3.JPG
 

About

The Proxmox community has been around for many years and offers help and support for Proxmox VE, Proxmox Backup Server, and Proxmox Mail Gateway.
We think our community is one of the best thanks to people like you!

Get your subscription!

The Proxmox team works very hard to make sure you are running the best software and getting stable updates and security enhancements, as well as quick enterprise support. Tens of thousands of happy customers have a Proxmox subscription. Get yours easily in our online shop.

Buy now!