Proxmox : 100% memory usage

quantum

Member
Dec 21, 2020
17
5
8
44
Hi there,

Proxmox UI shows memory usage of 98.07%, and htop shows indeed usage of about 95% memory.

I have 32 GB total memory, and the following VMs :
vm1 : 6GB used of 8GB
vm2 : 1GB used of 2GB
vm3 : 2GB used of 4GB

and Containers :
ct1 : 1GB used of 2GB
ct2 : 0.5GB used of 2GB
ct3 : 2GB used of 4GB

  • max memory usage for containers and VMS : 8+2+4+2+2+4 = 22GB MAX
  • current memory usage for containers and VMS : 6+1+2+1+0.5+2 = 12.5 GB

The problem is : how it is possible that my proxmox server use all the ram, regarding containers and VMs usage and declaration ?


When I shutdown a given container, the total RAM amount don't change. When I shutdown a VM, the RAM is freedup accordingly. But it doesn't explain why the +95% memory usage..

Do you have some pointers please ?

Q. M.
 
Generally, the host also needs some memory. This can also be quite a lot, if you use ZFS for example.

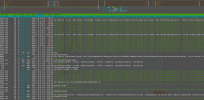
Could you share a screenshot of the htop output and the exact configuration of one container and one virtual machine?
 
Last edited:
Thank for your tips.

I have a very simple use of Proxmox, and I don't use ZFS.

Some details asked bellow :

cat /proc/meminfo
MemTotal: 32774444 kB
MemFree: 270256 kB
MemAvailable: 894984 kB
Buffers: 36716 kB
Cached: 400168 kB
SwapCached: 163556 kB
Active: 8470768 kB
Inactive: 2077892 kB
Active(anon): 8288012 kB
Inactive(anon): 1910808 kB
Active(file): 182756 kB
Inactive(file): 167084 kB
Unevictable: 26448 kB
Mlocked: 26448 kB
SwapTotal: 8388604 kB
SwapFree: 3432900 kB
Dirty: 332 kB
Writeback: 0 kB
AnonPages: 10001496 kB
Mapped: 208908 kB
Shmem: 76516 kB
KReclaimable: 743732 kB
Slab: 14427964 kB
SReclaimable: 743732 kB
SUnreclaim: 13684232 kB
KernelStack: 13824 kB
PageTables: 66200 kB
NFS_Unstable: 0 kB
Bounce: 0 kB
WritebackTmp: 0 kB
CommitLimit: 24775824 kB
Committed_AS: 30110004 kB
VmallocTotal: 34359738367 kB
VmallocUsed: 175600 kB
VmallocChunk: 0 kB
Percpu: 9435328 kB
HardwareCorrupted: 0 kB
AnonHugePages: 122880 kB
ShmemHugePages: 0 kB
ShmemPmdMapped: 0 kB
FileHugePages: 0 kB
FilePmdMapped: 0 kB
CmaTotal: 0 kB
CmaFree: 0 kB
HugePages_Total: 0
HugePages_Free: 0
HugePages_Rsvd: 0
HugePages_Surp: 0
Hugepagesize: 2048 kB
Hugetlb: 0 kB
DirectMap4k: 21055728 kB
DirectMap2M: 12386304 kB
DirectMap1G: 0 kB


Capture du 2021-04-29 11-48-53.png

configuration of one CT (plex) :

arch: amd64
cores: 12
cpuunits: 512
hostname: plex
memory: 4096
mp0: /mnt/sda1/downloads,mp=/downloadsA
mp1: /mnt/sdb1/downloads,mp=/downloadsB
net0: name=eth0,bridge=vmbr0,firewall=1,gw=*.*.*.*,hwaddr=*:*:*:*:*:*,ip=*.*.*.*/32,type=veth
onboot: 1
ostype: debian
rootfs: localhdd:100/vm-100-disk-0.raw,size=16G
swap: 512
unprivileged: 1
lxc.prlimit.nofile: 30000

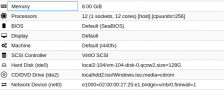
configuration of one VM (windows) :

Capture du 2021-04-29 11-58-12.png

Thanks!
 
Last edited:
=> Also no check_mk?

Does something interesting appear when you sort htop by virtual, shared, or % memory?
 
Unfortunatetly, no check_mk on that server.

When I sort processes by memory (either with HTOP or command line), I have exactly this :

Bash:
ps -eo pmem,pcpu,vsize,pid,cmd | sort -k 1 -nr

%MEM %CPU VSZ PID CMD
22.6 20.4 9496088 11962 /usr/bin/kvm -id 104 -name windows -no-shutdown -chardev socket,id=qmp,path
7.4 12.3 4804976 6527 /usr/bin/kvm -id 112 -name gitlab -no-shutdown -chardev socket,id=qmp,path
0.4 2.0 2176008 4651 /usr/bin/kvm -id 111 -name jenkins -no-shutdown -chardev socket,id=qmp,path
0.4 0.0 5917864 30340 /usr/bin/java -jar /usr/lib/jdownloader/JDownloader.jar
0.2 0.8 9341540 28964 /usr/sbin/mysqld
0.1 0.8 300088 1443 pvestatd
0.1 0.0 145140 765 /lib/systemd/systemd-journald
0.0 4.5 0 91 [ksmd]
0.0 0.3 302240 1444 pve-firewall
...
(then one hundred of processes with 0.0% memory usage)

As you can see, 22.6% + 7.4% + 0.4% + 0.4% + 0.2% + 0.1% + 0.1% + n * 0.0% is about 30% memory usage only.

So I definitely don't know why both top and htop returns 95% memory usage, even if I stop a given container that is consuming memory.

May be the system is doing caching with some stuff, but it's unclear.

The server is running from 100 days with Proxmox VE 6.3.

Do you think it could be a proxmox bug ? Or might I have to fill an issue on the Debian 10 community ?

Still very strange..

Thanks!
 
Last edited:
Did you checked with free -h that all the RAM is really "used" and not much of that is just "available"?
 
Hi dunuin

29GB of 31GB seems really to be used (not cached). And it does not match the true 30% memory usage reported by unix "ps" if I check and sum the processes one by one.

Code:
$ free -h

total used free shared buff/cache available
Mem: 31Gi 29Gi 274Mi 85Mi 1.1Gi 843Mi
Swap: 8.0Gi 4.7Gi 3.3Gi

It definitely sounds like about a memory leak somewhere.. but I don't know if the bug is on the Debian V10.8 side, the Proxmox V6.3 side, or even at kernel side (Linux 5.4.73-1-pve) ..

Thanks for helping
 
Last edited:
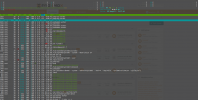
I have stopped every single containers and VMS, and the system consumes 20GB memory without doing anything.

Capture du 2021-04-29 15-00-55.png

wow, how this is ever possible ?
 
As a workaround, I finally end up to fully reboot the system. Not very production-friendly, but consumption of RAM is then back to normal.

I took some additionnal actions :

- From PVE GUI, I completely disable memory balloning on each Proxmox VM. May be not related, but I prefer to have predictable RAM consumation after such weird situations..
- From SYSTEMCTL.conf, I reduce `vm.max_map_count`, which may be have increase the memory usage anormally. May be not related too thus.
- Setup check_mk
- Check regularly for memory evolution
 
Last edited:
Did you run any Win VMs with ballooning drivers? There were memoryleaks with a specific driver version some moths ago and it was recommended to disable balooning for Win VMs.
 
  • Like
Reactions: Dominic
Hi Dunuin,

Thanks for the information

Yes I currently run a Windows 10 VM, and have seen from the GUI (with Advanced option) that Proxmox turn on by default ballooning. However I don't know the driver or the version of it.

So I don't know if it is really related, but anyways, for production workload I think I will stick on non-balloning VMs, it is a bit more "predictable"
 
Hi Dominic,

I was not aware of this "in progress" article about Windows 10 at all. But, I work with pretty good hardware (NVME, DDR4, ..) so I don't notice any performance drawbacks by stucking with simple Proxmox configuration without any particular additions.

Anyway, my thread was not about performance. It was about the fact that my memory was eatten by Proxmox, even when I turned down every Containers and VMs.

And it is NOT the typical problem "Linux eat RAM because the used memory also refers to cached data". Indeed, while the total memory allocated to containers and VMs was low, the `free -h` command was still saying that I have about half of the swap used. Such command also said that there is very few "available" memory. So the memory was not "used" because of cache, but really used!

So, I most likely suspect memory leaks, may be related with VM Windows, or Promox (may be related to balloning..), but difficult to say exactly !

Anyway I have took the actions discussed above (disable completely balooning on VM, turn on checkmk, ..), and I will see it is better or not, the next 100 days :)

I just hope there was NOT a memory leak inside Proxmox, because in that case, it is likely to continue again..

Thanks
Quantum
 
Last edited:

About

The Proxmox community has been around for many years and offers help and support for Proxmox VE, Proxmox Backup Server, and Proxmox Mail Gateway.
We think our community is one of the best thanks to people like you!

Get your subscription!

The Proxmox team works very hard to make sure you are running the best software and getting stable updates and security enhancements, as well as quick enterprise support. Tens of thousands of happy customers have a Proxmox subscription. Get yours easily in our online shop.

Buy now!