Periodically VMs Show ? as status

ahwelp

New Member
Nov 11, 2022
5
0
1
Hello fellow ProxMoxers!

I am running a home server with a machine with lower hardware.

Code:
4 x Intel(R) Core(TM) i5-3330 CPU @ 3.00GHz
1 X 8Gb Ram DDR3

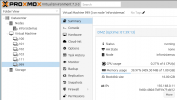
It is working... fine, but sometimes the web interface simply get me nuts!

All VMs show a unkonwn status and hide their IDs and names. With a reboot everything comes back fine. But the idea is 24/7 availability.
The Web interface is as the file attachment

How to revert this on a running instance and prevent it from happening again?

Thanks!
 

Attachments

  • Captura de tela de 2023-02-02 15-55-31.png
    Captura de tela de 2023-02-02 15-55-31.png
    59.2 KB · Views: 8
Also...

When trying to create or clone a VM, the node lists as offline, even the computer on and the VMs running
 

Attachments

  • vm_bug.jpeg
    vm_bug.jpeg
    118.9 KB · Views: 4
I would try to log in using SSH and then run systemctl status pve*.service to check if all PVE services are up and running without any errors/warnings in the journal. I would guess one of them like "pveproxy" or "pve-cluster" got a problem.
 
In addition:
When the problem occurs, what is the full output in code-tags of: pvesm status?

This behavior can also often be seen, in cases where there is a problem with a storage and/or its reachability.
 
Looking at the pve*.service there were multiple services with faults.

I restarted the pvestatd and a few seconds latter, the GUI worked again

The log for the pvestatd was:

Code:
● pvestatd.service - PVE Status Daemon
     Loaded: loaded (/lib/systemd/system/pvestatd.service; enabled; vendor preset: enabled)
     Active: failed (Result: signal) since Thu 2023-02-02 15:43:15 -03; 1h 35min ago
    Process: 1049 ExecStart=/usr/bin/pvestatd start (code=exited, status=0/SUCCESS)
   Main PID: 1060 (code=killed, signal=SEGV)
        CPU: 3h 20min 10.978s

Feb 02 11:57:24 <hostname> pvestatd[1060]: VM 111 qmp command failed - VM 111 qmp command 'query-proxmox-support' failed - got timeout
Feb 02 11:57:24 <hostname> pvestatd[1060]: status update time (9.300 seconds)
Feb 02 11:57:33 <hostname> pvestatd[1060]: VM 111 qmp command failed - VM 111 qmp command 'query-proxmox-support' failed - got timeout
Feb 02 11:57:33 <hostname> pvestatd[1060]: status update time (8.192 seconds)
Feb 02 11:57:43 <hostname> pvestatd[1060]: VM 111 qmp command failed - VM 111 qmp command 'query-proxmox-support' failed - unable to
connect to VM 111 qmp socket - timeout after 51 retries
Feb 02 11:57:44 <hostname> pvestatd[1060]: status update time (8.215 seconds)
Feb 02 15:37:56 <hostname> pvestatd[1060]: command '/sbin/lvs --separator : --noheadings --units b --unbuffered --nosuffix --config 'report/time_format="%s"' --options vg_name,lv_name,lv_size,lv_attr,pool_lv,data_percent,metadata_percent,snap_percent,uuid,tags,metadata_size,time' failed: got signal 11
Feb 02 15:43:15 <hostname> systemd[1]: pvestatd.service: Main process exited, code=killed, status=11/SEGV
Feb 02 15:43:15 <hostname> systemd[1]: pvestatd.service: Failed with result 'signal'.
Feb 02 15:43:15 <hostname> systemd[1]: pvestatd.service: Consumed 3h 20min 10.978s CPU time.
 
In addition:
When the problem occurs, what is the full output in code-tags of: pvesm status?

This behavior can also often be seen, in cases where there is a problem with a storage and/or its reachability.

Code:
root@<hostname>:~# pvesm status
Name              Type     Status           Total            Used       Available        %
hard_drive         lvm     active       976756736       100663296       876093440   10.31%
local              dir     active        57225328        11734528        42551512   20.51%
local-lvm      lvmthin     active       148299776        31647172       116652603   21.34%

Is this from before or after you:
I restarted the pvestatd
?

Code:
Feb 02 15:37:56 <hostname> pvestatd[1060]: command '/sbin/lvs --separator : --noheadings --units b --unbuffered --nosuffix --config 'report/time_format="%s"' --options vg_name,lv_name,lv_size,lv_attr,pool_lv,data_percent,metadata_percent,snap_percent,uuid,tags,metadata_size,time' failed: got signal 11
Feb 02 15:43:15 <hostname> systemd[1]: pvestatd.service: Main process exited, code=killed, status=11/SEGV

Would check the syslog around this time.
 
Is this from before or after you:

?


Would check the syslog around this time.

The pvesm status was taken after the restart. I did not loged it before restarting the service.

The syslog was taken before the restart. I saved the log on a file to have a reference.

The VM 111 is ruining Ubuntu 18.04 with PHP, Apache and Postgres. Also, is common to the VM overwrite the console with kernel panics. This is common on all VMs. This is a point I would open a new question, but the logs on the VMs are on the attachment, maybe we can see something over here.

It seems that a timeout while checking a VM status killed the pvestatd service. Now, why it happens?
 

Attachments

  • Captura de tela de 2023-02-02 15-57-00.png
    Captura de tela de 2023-02-02 15-57-00.png
    240 KB · Views: 4

About

The Proxmox community has been around for many years and offers help and support for Proxmox VE, Proxmox Backup Server, and Proxmox Mail Gateway.
We think our community is one of the best thanks to people like you!

Get your subscription!

The Proxmox team works very hard to make sure you are running the best software and getting stable updates and security enhancements, as well as quick enterprise support. Tens of thousands of happy customers have a Proxmox subscription. Get yours easily in our online shop.

Buy now!