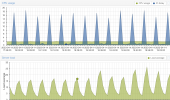
Periodic I/O Delay Spike Every 5 Minutes

Moonrocks

New Member
Apr 14, 2023
22
3
3
Hello
I have a Proxmox cluster with 2 nodes.
Node 1 runs VMs and node 2 has around 80 CTs on it.
I’m facing an issue on node 2, the I/O Delay jumps to 50% - 80% exactly every 5 minutes.

The storage is as follows.
Boot Disk/local-lvm : 1 TB Samsung EVO SSD (CTs are NOT stored on this, only used for boot)

5x 8TB Enterprise HDD 7200 RPM (12Gigbit SAS) in RAID 5 controlled by DELL Hardware Raid.

The VD is partitioned into 2x 14TB xfs and one of the partition is mounted at /mnt/pve/DATA
This directory is then added as storage “as type directory” and CT disks are stored on it. The second partition is left unused/unmounted at the moment.

I tried to look for any CT which might be overusing I/O, but couldn’t find a CT that had a usage graph that co-relates with the rise in I/O Delay.
Also looked at iotop, the disk usage remains mostly the same during the period of increased I/O delay compared to when the I/O Delay is not there.

The spike happens exactly every 5 minutes.

Any help would be highly appreciated
 
Hello,

I would like to share my experience with Proxmox and consumer/prosumer SSD's. We currently running several servers with also consumer/prosumer SSD's as boot only (not for storing any CT/VM disks). Also we have several servers running with enterprise SSD's used as boot.

The thing we see is that the ones without enterprise SSD only for boot have sometimes, in our case exactly when we make a backup via VZdump to an external storage, quite raising I/O delay. I think this happens because Proxmox has processes to do on our boot disk which is not an enterprise SSD. The second reason could be the Dell Hardware Raid controller.

If you are sure that there is no CT or VM running on the 1 TB Samsung EVO SSD then it could be the reason that there is somehow node activity every 5 minutes. Maybe there is running a cronjob with a specific process which causes the node to a lot of I/O delay since you're using a prosumer SSD?

I was just sharing our experience with pro/consumer SSD's we have decided to only use enterprise SSD's for new installations in order to avoid this problem.

I hope this will help you a bit.
 
Hi there,
Thank you for sharing the info!
There are no backup jobs running/scheduled. Also there are no CTs/VMs running on the boot disk (Consumer SSD). They’re only running on the RAID Array which is made up of Enterprise HDDs.

I’d like to add however that our other node runs around 45 VMs on 4x Samsung Pro SSD in a RAID Array with amazing performance and no I/O Delays at all.

Would a PCIe card cause I/O Delays? The 2 nodes in the cluster communicate over a 10G PCIe Network Card.
 
Last edited:
Hello,

Thank you for sharing the info to! Nice to hear, but be aware of the wear-out (depending what you running on the VM's) this SSD's could wear-out rapidly and also the don't have a good PlP. (Power Lost Protection) but I think in your case this is maybe not the bottleneck. Be aware that also the Dell Hardware Raid could cause the delay, do you also use ZFS for this disk array?

The PCIe card could indeed cause I/O delay, which PCIe do you use exactly?
 
Not using ZFS. We have simply formatted the array as xfs and mounted the array on a directory, then add directory as storage on Proxmox.

Its a generic PCIe Fibre card. Takes SFP+ modules. We’ve been using it for a year on a different server with no issues. How exactly would you pinpoint what is causing an I/O delay? iotop only shows the disk and as I mentioned before, the disk usage is mostly the same, during the time of I/O Spike and when the spike is not there.

Also would like to add that the spike only happens for aprox 2-3 secs and then goes back to normal.
 
Last edited:
Not using ZFS. We have simply formatted the array as xfs and mounted the array on a directory, then add directory as storage on Proxmox.

Its a generic PCIe Fibre card. Takes SFP+ modules. We’ve been using it for a year on a different server with no issues.

Good to know. I think in this case the best option you have is not monitor the I/O delay via iostat in order to determine where it is coming from. My guess would be something with the Hardware array after a sync (which could happen after exactly 5 minutes).
 
  • Like
Reactions: Moonrocks
Good to know. I think in this case the best option you have is not monitor the I/O delay via iostat in order to determine where it is coming from. My guess would be something with the Hardware array after a sync (which could happen after exactly 5 minutes).
Is there any way to confirm this?
 
PERC H730
Server is Dell R730XD

Thanks for the information I lookup real quick but couln't find any issues relating to this model. Since there are no SSD's for the VM host could you try to disable swap on the VM? (vm.swappiness=0) This is what I used to do when we had in the past high IO delay. Maybe this could work but I am not sure at this point sorry!

We use R630's and HP DL360's so I dont have the experience with this specific model.
 
Last edited:
Thanks for the information I lookup real quick but couln't find any issues relating to this model. Since there are no SSD's for the VM host could you try to disable swap on the VM? (vm.swappiness=0) This is what I used to do when we had in the past high IO delay. Maybe this could work but I am not sure at this point sorry!

We use R630's and HP DL360's so I dont have the experience with this specific model.
Thank you so much for looking into this.

I have disabled swap on the host node “swapoff -a”
Do I also need to turn it off on the CTs?
 
Thank you so much for looking into this.

I have disabled swap on the host node “swapoff -a”
Do I also need to turn it off on the CTs?
Sounds good. I run containers always without swap so you could try to disable this to. However maybe it's better to see if it works for now, if not you could always try to also disable swap for your CTs.
 
Sounds good. I run containers always without swap so you could try to disable this to. However maybe it's better to see if it works for now, if not you could always try to also disable swap for your CTs.
Disabling swap doesnt seem to make a difference.
 
Disabling swap doesnt seem to make a difference.
Hmm, that's unfortunate. Could you please provide me more details about the CPU specs of the node? And maybe do you have a screenshot of the statistics on the node?

Thanks in advance!
 
CPU: 2 x Intel(R) Xeon(R) CPU E5-2686 v4 @ 2.30GHz (2 Sockets) - 72 Threads
RAM: 64 GB DDR4 2400 Mhz (Around 13.77 GiB in use).

Graph set to One Hour (Maximum)


Screenshot 2023-04-14 at 7.08.10 PM.png
 
Last edited:
On one of my drives in my Array, I'm seeing

Elements in grown defect list: 2 is this a concern?

Code:
smartctl -a /dev/sdb -d megaraid,0
smartctl 7.2 2020-12-30 r5155 [x86_64-linux-5.15.30-2-pve] (local build)
Copyright (C) 2002-20, Bruce Allen, Christian Franke, www.smartmontools.org

=== START OF INFORMATION SECTION ===
Vendor:               HGST
Product:              H7280A520SUN8.0T
Revision:             PD51
Compliance:           SPC-4
User Capacity:        7,865,536,647,168 bytes [7.86 TB]
Logical block size:   512 bytes
Physical block size:  4096 bytes
Formatted with type 1 protection
8 bytes of protection information per logical block
LU is fully provisioned
Rotation Rate:        7200 rpm
Form Factor:          3.5 inches
Logical Unit id:      0x5000cca260df37cc
Serial number:        001704PYSM9V        VLKYSM9V
Device type:          disk
Transport protocol:   SAS (SPL-3)
Local Time is:        Fri Apr 14 19:17:27 2023 PKT
SMART support is:     Available - device has SMART capability.
SMART support is:     Enabled
Temperature Warning:  Enabled

=== START OF READ SMART DATA SECTION ===
SMART Health Status: OK

Current Drive Temperature:     28 C
Drive Trip Temperature:        85 C

Accumulated power on time, hours:minutes 35854:37
Manufactured in week 04 of year 2020
Specified cycle count over device lifetime:  50000
Accumulated start-stop cycles:  72
Specified load-unload count over device lifetime:  600000
Accumulated load-unload cycles:  1543
Elements in grown defect list: 2

Vendor (Seagate Cache) information
  Blocks sent to initiator = 11059458360737792

Error counter log:
           Errors Corrected by           Total   Correction     Gigabytes    Total
               ECC          rereads/    errors   algorithm      processed    uncorrected
           fast | delayed   rewrites  corrected  invocations   [10^9 bytes]  errors
read:          0      408         0       408    5950893    1027219.199           0
write:         0      158         0       158   12645477     116612.855           0
verify:        0     2461         0      2461     604008       7489.027           0

Non-medium error count:        0

No Self-tests have been logged
 
Why does your CPU load go up and down in the same rhythm? If it's a hardware issue like a drive or controller I would not expect the anti-synchronous CPU usage.
Did you stop all VMs and CTs and still see this rhythm of CPU waves between the IO peaks? Do you have BOINC or Folding@Home or similar running maybe?

EDIT: Sorry, I meant the load average instead of CPU. It peaks in between I/O delay.
 
Last edited:
Why does your CPU load go up and down in the same rhythm? If it's a hardware issue like a drive or controller I would not expect the anti-synchronous CPU usage.
Did you stop all VMs and CTs and still see this rhythm of CPU waves between the IO peaks? Do you have BOINC or Folding@Home or similar running maybe?
CPU load is constant. The blue spike shows the IO Delay.
The green straight line in the first graph shows CPU Usage. (Or am I wrong?)
I stopped some CTs which were using I/O slightly intensely, no change. I will try to stop all CTs and see if the behaviour remains. Is there a quick way to stop all CTs?

The CTs are used by tenants so could be anything running on them.
However, as I said before there isnt a single CT which has a usage graph that correlates to the IO Delay graph.
 
Last edited:
On one of my drives in my Array, I'm seeing

Elements in grown defect list: 2 is this a concern?

Code:
smartctl -a /dev/sdb -d megaraid,0
smartctl 7.2 2020-12-30 r5155 [x86_64-linux-5.15.30-2-pve] (local build)
Copyright (C) 2002-20, Bruce Allen, Christian Franke, www.smartmontools.org

=== START OF INFORMATION SECTION ===
Vendor:               HGST
Product:              H7280A520SUN8.0T
Revision:             PD51
Compliance:           SPC-4
User Capacity:        7,865,536,647,168 bytes [7.86 TB]
Logical block size:   512 bytes
Physical block size:  4096 bytes
Formatted with type 1 protection
8 bytes of protection information per logical block
LU is fully provisioned
Rotation Rate:        7200 rpm
Form Factor:          3.5 inches
Logical Unit id:      0x5000cca260df37cc
Serial number:        001704PYSM9V        VLKYSM9V
Device type:          disk
Transport protocol:   SAS (SPL-3)
Local Time is:        Fri Apr 14 19:17:27 2023 PKT
SMART support is:     Available - device has SMART capability.
SMART support is:     Enabled
Temperature Warning:  Enabled

=== START OF READ SMART DATA SECTION ===
SMART Health Status: OK

Current Drive Temperature:     28 C
Drive Trip Temperature:        85 C

Accumulated power on time, hours:minutes 35854:37
Manufactured in week 04 of year 2020
Specified cycle count over device lifetime:  50000
Accumulated start-stop cycles:  72
Specified load-unload count over device lifetime:  600000
Accumulated load-unload cycles:  1543
Elements in grown defect list: 2

Vendor (Seagate Cache) information
  Blocks sent to initiator = 11059458360737792

Error counter log:
           Errors Corrected by           Total   Correction     Gigabytes    Total
               ECC          rereads/    errors   algorithm      processed    uncorrected
           fast | delayed   rewrites  corrected  invocations   [10^9 bytes]  errors
read:          0      408         0       408    5950893    1027219.199           0
write:         0      158         0       158   12645477     116612.855           0
verify:        0     2461         0      2461     604008       7489.027           0

Non-medium error count:        0

No Self-tests have been logged

This could potentially means that one of your drives is going to fail sooner or later indeed.
 

About

The Proxmox community has been around for many years and offers help and support for Proxmox VE, Proxmox Backup Server, and Proxmox Mail Gateway.
We think our community is one of the best thanks to people like you!

Get your subscription!

The Proxmox team works very hard to make sure you are running the best software and getting stable updates and security enhancements, as well as quick enterprise support. Tens of thousands of happy customers have a Proxmox subscription. Get yours easily in our online shop.

Buy now!