as response to myself with the higher power consumtion. Fixed it by installing the latest revision and a couple of reboots. No idea what cause it, but one core stayed stuck on Max Freq. Now its back to normal. (7.0.2-4-pve)


Opt-in Linux 7.0 Kernel for Proxmox VE 9 available
- Thread starter t.lamprecht
- Start date
You are using an out of date browser. It may not display this or other websites correctly.
You should upgrade or use an alternative browser.
You should upgrade or use an alternative browser.

@Weltherrscher I found an upstream patch that should resolve the issue and pinged the maintainers about it. It's a bit strange that nobody else is running into this issue, but it might depend on the specific workload pattern/guest kernel (the patch was made after the issue was found via fuzzing).
Last edited:

Thank you for your reply! =)
Anyway, i keep hitting DMAR errors for the X540 VFs even with iommu=pt in Kernel 7.0.2-4:
Right now, my iSCSI network broke again, having to restart the NAS VM.
I now try to use the VM without vIOMMU inside (vIOMMU=none, was before intel(amd compatible))...
Anyway, i keep hitting DMAR errors for the X540 VFs even with iommu=pt in Kernel 7.0.2-4:
Code:
May 19 22:44:52 px1 QEMU[3776]: kvm: vfio_container_dma_map(0x595d88370dd0, 0xe10bb000, 0x1000, 0x7834682db000) = -28 (No space left on device)
May 19 22:44:52 px1 kernel: DMAR: DRHD: handling fault status reg 2
May 19 22:44:52 px1 kernel: DMAR: [DMA Read NO_PASID] Request device [04:10.0] fault addr 0xe2162000 [fault reason 0x06] PTE Read access is not set
May 19 22:44:52 px1 kernel: DMAR: DRHD: handling fault status reg 102
May 19 22:44:52 px1 kernel: DMAR: [DMA Read NO_PASID] Request device [04:10.0] fault addr 0xe20bb000 [fault reason 0x06] PTE Read access is not set
May 19 22:44:52 px1 QEMU[3776]: kvm: vfio_container_dma_map(0x595d88370dd0, 0xe10ba000, 0x1000, 0x7834682da000) = -28 (No space left on device)I now try to use the VM without vIOMMU inside (vIOMMU=none, was before intel(amd compatible))...
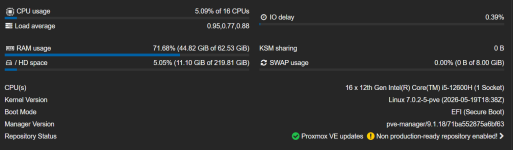
as response to myself with the higher power consumtion. Fixed it by installing the latest revision and a couple of reboots. No idea what cause it, but one core stayed stuck on Max Freq. Now its back to normal. (7.0.2-4-pve)
I am still stuck on the higher power consumption. Kernel 7.0.2-6 and Proxmox 9.2.2
What do you mean with installing the latest revision? Revision of what? As I am trying to find a solution.
Kernel: 7.0.2-6-pve
HW CPU: AMD GX-424CC
I am experiencing very high CPU usage after a kernel update.
There is a huge overhead in CPU usage in SY time.
perf output:
mitigations=off also does not resolve the issue.
The issue does not occur on kernel 6.17.
HW CPU: AMD GX-424CC
I am experiencing very high CPU usage after a kernel update.
There is a huge overhead in CPU usage in SY time.
perf output:
Code:
+ 41.10% 0.05% [kernel] [k] entry_SYSCALL_64_after_hwframe
+ 41.05% 0.10% [kernel] [k] do_syscall_64
+ 40.59% 0.12% [kernel] [k] x64_sys_call
+ 27.84% 0.58% [kernel] [k] kvm_arch_vcpu_ioctl_run
+ 16.87% 1.50% [kernel] [k] __schedule
+ 15.73% 0.14% [kernel] [k] schedule
+ 12.36% 0.01% [kernel] [k] kvm_vcpu_halt
+ 12.29% 0.05% [kernel] [k] kvm_vcpu_block
+ 8.76% 0.09% [kernel] [k] do_idle
+ 7.49% 0.45% [kernel] [k] try_to_wake_up
+ 7.24% 0.08% [kernel] [k] __kvm_vcpu_kick
+ 7.21% 0.02% [kernel] [k] wake_up_process
+ 7.14% 0.11% [kernel] [k] rcuwait_wake_up
+ 5.68% 0.00% [kernel] [k] call_cpuidle
+ 5.65% 0.22% [kernel] [k] ttwu_do_activate
+ 5.60% 0.09% [kernel] [k] cpuidle_enter_state
+ 5.53% 0.00% libc.so.6 [.] ioctl
+ 5.51% 0.00% [unknown] [k] 0x70632d34365f3638
+ 5.51% 0.00% [unknown] [k] 0x00000000000001b8
+ 5.51% 0.00% [unknown] [k] 0x0000633e38f33140
+ 5.51% 0.00% libglib-2.0.so.0.8400.4 [.] g_free
+ 5.39% 0.00% libc.so.6 [.] 0x000075cf23379b7b
+ 5.36% 0.01% [kernel] [k] asm_exc_page_fault
+ 5.27% 0.00% [kernel] [k] __x64_sys_ioctl
+ 5.27% 0.00% [kernel] [k] kvm_vcpu_ioctl
+ 5.18% 0.03% [kernel] [k] exc_page_fault
+ 4.96% 0.11% [kernel] [k] do_user_addr_fault
+ 4.81% 0.02% [kernel] [k] acpi_idle_enter
+ 4.80% 0.01% [kernel] [k] cpuidle_enter
+ 4.72% 0.65% [kernel] [k] pick_next_task_fair
+ 4.65% 0.07% [kernel] [k] handle_mm_fault
+ 4.64% 0.21% [kernel] [k] enqueue_task
+ 4.56% 0.19% [kernel] [k] __handle_mm_fault
+ 4.55% 0.15% [kernel] [k] dequeue_task
+ 4.50% 0.00% perf [.] 0x000056d1ebedc3f4
+ 4.47% 0.00% perf [.] 0x000056d1ec0538b3
+ 4.36% 0.21% [kernel] [k] dequeue_task_fair
+ 4.14% 0.00% perf [.] 0x000056d1ebedcbe8
+ 4.11% 1.20% [kernel] [k] dequeue_entities
+ 4.09% 1.12% [kernel] [k] pv_native_safe_halt
mitigations=off also does not resolve the issue.
Code:
root@p1 ~ # cat /etc/kernel/cmdline
root=ZFS=rpool/ROOT/pve-1 boot=zfs mitigations=off

root@p1 ~ # cat /proc/cmdline
initrd=\EFI\proxmox\7.0.2-6-pve\initrd.img-7.0.2-6-pve root=ZFS=rpool/ROOT/pve-1 boot=zfs mitigations=off
The issue does not occur on kernel 6.17.
This looks like the same issue as Post #97Kernel: 7.0.2-6-pve
HW CPU: AMD GX-424CC
I am experiencing very high CPU usage after a kernel update.
There is a huge overhead in CPU usage in SY time.
perf output:
Code:+ 41.10% 0.05% [kernel] [k] entry_SYSCALL_64_after_hwframe + 41.05% 0.10% [kernel] [k] do_syscall_64 + 40.59% 0.12% [kernel] [k] x64_sys_call + 27.84% 0.58% [kernel] [k] kvm_arch_vcpu_ioctl_run + 16.87% 1.50% [kernel] [k] __schedule + 15.73% 0.14% [kernel] [k] schedule + 12.36% 0.01% [kernel] [k] kvm_vcpu_halt + 12.29% 0.05% [kernel] [k] kvm_vcpu_block + 8.76% 0.09% [kernel] [k] do_idle + 7.49% 0.45% [kernel] [k] try_to_wake_up + 7.24% 0.08% [kernel] [k] __kvm_vcpu_kick + 7.21% 0.02% [kernel] [k] wake_up_process + 7.14% 0.11% [kernel] [k] rcuwait_wake_up + 5.68% 0.00% [kernel] [k] call_cpuidle + 5.65% 0.22% [kernel] [k] ttwu_do_activate + 5.60% 0.09% [kernel] [k] cpuidle_enter_state + 5.53% 0.00% libc.so.6 [.] ioctl + 5.51% 0.00% [unknown] [k] 0x70632d34365f3638 + 5.51% 0.00% [unknown] [k] 0x00000000000001b8 + 5.51% 0.00% [unknown] [k] 0x0000633e38f33140 + 5.51% 0.00% libglib-2.0.so.0.8400.4 [.] g_free + 5.39% 0.00% libc.so.6 [.] 0x000075cf23379b7b + 5.36% 0.01% [kernel] [k] asm_exc_page_fault + 5.27% 0.00% [kernel] [k] __x64_sys_ioctl + 5.27% 0.00% [kernel] [k] kvm_vcpu_ioctl + 5.18% 0.03% [kernel] [k] exc_page_fault + 4.96% 0.11% [kernel] [k] do_user_addr_fault + 4.81% 0.02% [kernel] [k] acpi_idle_enter + 4.80% 0.01% [kernel] [k] cpuidle_enter + 4.72% 0.65% [kernel] [k] pick_next_task_fair + 4.65% 0.07% [kernel] [k] handle_mm_fault + 4.64% 0.21% [kernel] [k] enqueue_task + 4.56% 0.19% [kernel] [k] __handle_mm_fault + 4.55% 0.15% [kernel] [k] dequeue_task + 4.50% 0.00% perf [.] 0x000056d1ebedc3f4 + 4.47% 0.00% perf [.] 0x000056d1ec0538b3 + 4.36% 0.21% [kernel] [k] dequeue_task_fair + 4.14% 0.00% perf [.] 0x000056d1ebedcbe8 + 4.11% 1.20% [kernel] [k] dequeue_entities + 4.09% 1.12% [kernel] [k] pv_native_safe_halt
mitigations=off also does not resolve the issue.
Code:root@p1 ~ # cat /etc/kernel/cmdline root=ZFS=rpool/ROOT/pve-1 boot=zfs mitigations=off root@p1 ~ # cat /proc/cmdline initrd=\EFI\proxmox\7.0.2-6-pve\initrd.img-7.0.2-6-pve root=ZFS=rpool/ROOT/pve-1 boot=zfs mitigations=off
The issue does not occur on kernel 6.17.
If
cat /sys/devices/system/clocksource/clocksource0/current_clocksource is hpet, and not tsc, then that is your problem, and the fix.no, read_hpet has 1% usage.This looks like the same issue as Post #97
Ifcat /sys/devices/system/clocksource/clocksource0/current_clocksourceishpet, and nottsc, then that is your problem, and the fix.
The heavy load here is generated by syscalls related to virtualization and context switching.
Is this the correct way to set it to force TSC?Update: Root cause found — HPET clocksource, not kernel 7.0
After further investigation, the high CPU usage was not caused by kernel 7.0 itself, but by the HPET (High Precision Event Timer) being used as the system clocksource.
Using perf top we identified that read_hpet was consuming ~60% of kernel CPU time. HPET is an older hardware timer that is expensive to read, and with multiple VMs polling the clocksource constantly (especially chronyd/NTP and PFSense), the kernel was overwhelmed with HPET reads.
The underlying issue was that TSC (Time Stamp Counter) was being flagged as unstable and the kernel fell back to HPET. This was confirmed by:
cat /sys/devices/system/clocksource/clocksource0/current_clocksource
hpet
The fix was to force TSC as reliable in /etc/kernel/cmdline:
root=ZFS=rpool/ROOT/pve-1 boot=zfs tsc=reliable
Followed by running proxmox-boot-tool kernel pin 7.0.0-3-pve
After rebooting with TSC as the active clocksource, CPU usage dropped from ~85% system time to ~7% system time, and kernel 7.0.0-3-pve is now running perfectly with all VMs at normal CPU levels.
Hardware: AMD Ryzen 3 PRO 2200GE
Note: This issue was present on kernel 6.17 as well, but kernel 7.0 made it significantly worse, which is what triggered the investigation.
nano /etc/default/grub
and than change the line: GRUB_CMDLINE_LINUX_DEFAULT="quiet clocksource=tsc tsc=reliable"
Is there any risk to set this? Do I risk the host not booting at all?
I've had to move back to the 6.x kernels.
Hosting multiple game rising storm 2 vietnam servers in windows we started seeing mass kicks for invalid RPC (packets) exactly the day we move to the 7.x kernel branch. So we will monitor now and see if this is resolved.
Hosting multiple game rising storm 2 vietnam servers in windows we started seeing mass kicks for invalid RPC (packets) exactly the day we move to the 7.x kernel branch. So we will monitor now and see if this is resolved.

What hardware is in use here? Mainly relevant would be network interface model(s), motherboard model and its firmware/BIOS version and CPU model. Also VM/CT configs.
- Kernel: Linux 6.17.13-11-pve
- Architecture: x86-64
- Hardware Vendor: Dell Inc.
- Hardware Model: PowerEdge R640
- BIOS Version 2.25.0
- Firmware Version: 2.25.0
- Firmware Date: Fri 2025-09-26
- Firmware Age: 7month 3w 4d
- 2x Intel(R) Xeon(R) Gold 6244 CPU @ 3.60GHz
- Intel(R) Ethernet 10G 4P X550/I350 rNDC
agent: 1,fstrim_cloned_disks=1
balloon: 0
bios: ovmf
boot: order=scsi0;ide0
cores: 4
cpu: x86-64-v3
machine: pc-q35-11.0
memory: 10240
name: prod-rs2v-srv2
net0: virtio=removed,bridge=vlan0,queues=4
numa: 1
ostype: win11
scsi0: vm_data:vm-108-disk-1,cache=writeback,discard=on,iothread=1,size=65G,ssd=1
scsi1: vm_data:vm-108-disk-3,cache=writeback,discard=on,iothread=1,size=65G,ssd=1
scsihw: virtio-scsi-single
smbios1: uuid=removed
sockets: 2
vmgenid: removed
root@prox001:~# qm config 108
agent: 1,fstrim_cloned_disks=1
balloon: 0
bios: ovmf
boot: order=scsi0;ide0
cores: 4
cpu: x86-64-v3
efidisk0: vm_data:vm-108-disk-0,efitype=4m,ms-cert=2023k,pre-enrolled-keys=1,size=1M
ide0: none,media=cdrom
machine: pc-q35-11.0
memory: 10240
meta: creation-qemu=9.2.0,ctime=1745503025
name: prod-rs2v-srv2
net0: virtio=removed,bridge=vlan0,queues=4
numa: 1
ostype: win11
scsi0: vm_data:vm-108-disk-1,cache=writeback,discard=on,iothread=1,size=65G,ssd=1
scsi1: vm_data:vm-108-disk-3,cache=writeback,discard=on,iothread=1,size=65G,ssd=1
scsihw: virtio-scsi-single
sockets: 2
tpmstate0: vm_data:vm-108-disk-2,size=4M,version=v2.0
vga: qxl
Last edited:
short update:
since I removed the vIOMMUs from all VM configs, they are running rockstable.
@fiona: is there an estimated schedule for the upstream patch in core.c?
If I get some spare time, I can check if it was related to my other issues, but UPS just delivered my new toy (X11DPU ) to play with.
In the short term it will replace the older X10DRU-i+ I am using right now.
since I removed the vIOMMUs from all VM configs, they are running rockstable.
@fiona: is there an estimated schedule for the upstream patch in core.c?
If I get some spare time, I can check if it was related to my other issues, but UPS just delivered my new toy (X11DPU
) to play with.In the short term it will replace the older X10DRU-i+ I am using right now.
Hello,
A couple of days ago, I updated a cluster of 4 hosts from 6.17.13-4 to the latest 7.0.2-6.
Hardware configuration:
The update correspond to the begin of the "red mountain"
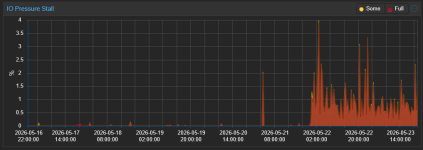
Is this expected or considered normal after the update? The reason I’m asking is that I can see the same behavior across all servers in the cluster.
If not, is there anything specific you would recommend checking?
Thanks.
A couple of days ago, I updated a cluster of 4 hosts from 6.17.13-4 to the latest 7.0.2-6.
Hardware configuration:
- 2x hosts with Xeon Gold 6148
- 2x hosts with Xeon E5-2660 v3
- All hosts use Samsung PM1735 NVMe drives on ZFS
The update correspond to the begin of the "red mountain"
Is this expected or considered normal after the update? The reason I’m asking is that I can see the same behavior across all servers in the cluster.
If not, is there anything specific you would recommend checking?
Thanks.
Last edited:
I'm waiting for a response from the maintainers.@fiona: is there an estimated schedule for the upstream patch in core.c?
Hi,
with QEMU 10.2, there was a switch to using io_uring for the IO thread event loops and the IO pressure/wait accounting is set via the io_uring subsystem now. It's a different kernel subsystem from before, so it's not unexpected if it's different.Everything seems to be working fine. However, since the reboot required to apply the update, I have noticed an increase in “IO Pressure Stall”.
The update correspond to the begin of the "red mountain"
no, read_hpet has 1% usage.
The heavy load here is generated by syscalls related to virtualization and context switching.
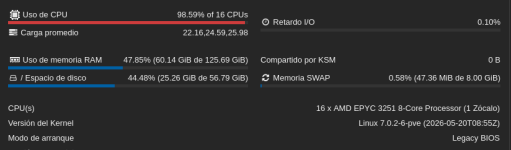
I can confirm similar behavior on a 4-node cluster running Proxmox VE 9.2.2.
Cluster hardware:
- 2x Intel Xeon E3-1220L v2
- 1x AMD EPYC 7551P
- 1x AMD EPYC 3251
Symptoms:
- Progressive performance degradation after ~2 days uptime on kernel 7.0.2-6-pve
- CPU usage gradually rises until the host reaches nearly 100% system CPU usage
- High load average with almost no IO wait
- All KVM guests are affected equally
- Host becomes nearly unusable
- Current clocksource is already tsc
- read_hpet usage is minimal (~1%)
- RAM, swap and IO usage remain normal
- The issue appears related to virtualization syscalls / context switching / scheduler activity
- powertop shows very high tick_nohz_handler, sched(softirq) and APIC timer activity
- dbs_work_handler activity is also unusually high
- The EPYC 7551P node running the same Proxmox/kernel version does NOT show the issue
- Changing CPU governor from ondemand to performance did not solve the problem
- Issue seems specific to the EPYC 3251 embedded platform
Last edited:
Leaving a link to this here as well so others looking for problems can see it: https://bugzilla.proxmox.com/show_bug.cgi?id=7627
TCP checksum offloading for virtio is broken for at least some NIC types on latest kernel + qemu for later linux guests / windows guests.
TCP checksum offloading for virtio is broken for at least some NIC types on latest kernel + qemu for later linux guests / windows guests.
I'm a relative novice with this stuff, so please excuse this noise if I am wrong, but that ^ smells a lot like: https://forum.proxmox.com/threads/a...-with-kernel-7-and-multiple-nic-types.183574/