NVME passthrough speed - "not bad", but unexpected

GarrettB

Well-Known Member
Jun 4, 2018
105
15
58
I have a TeamGroup 1TB nvme that is advertised to do 1800/1500 read/write MB/s. It is a PCIE3.0 4x drive, using a M.2 to PCIE adapter with backwards compatibility to 2.0. The motherboard only has PCIE2.0 slots (a 16x and 4x). The reduction in speed is seen noted in dmesg where 0000:00:15.0 is the PCI bridge:
Code:
pci 0000:07:00.0: 16.000 Gb/s available PCIe bandwidth, limited by 5.0 GT/s PCIe x4 link at 0000:00:15.0 (capable of 31.504 Gb/s with 8.0 GT/s PCIe x4 link)

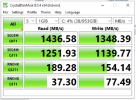
The drive is passing through fine to a Windows 10 VM, but CrystalDiskMark is suprisingly (and consistently) showing write speeds to be the same or slightly higher, not to mention both speeds slower than expected (with default test settings):
1695930094234.png

This drive is being used to run the OS - it is not secondary storage.

Given the speeds, it seems to me that it's being limited to 2 channels, or maybe PCIE1.0 1.0GB/s?

What I have tried:
  • rombar on and off
  • switching pcie slots (there is also a PCIE2.0 16x)
  • Installed in a second (motherboard identical) machine - that machine is running Ubuntu22 and it recognized ok with expected read/write speeds, and uses the same make of graphics card (see next section).
What I have not tried:
  • Removing a graphics card in pci slot 1:00.0 that is using 8 channels of the PCIE2.0 16x slot.

I don't understand this as well as I would like to, which is partly why I am posting. PCIE2.0 on 4 lanes should be a 2.0GB/s...higher than the drive speeds advertised. It just doesn't seem right to me...especially since write speed is higher. After double-checking passthrough settings, I figured I should just post it and see what anyone thinks.
 
Don't compare different benchmark tools. Advertised performance is also for very short and small bursts of writes (so DRAM can cache it as the NAND itself won't be able to write faster than a few hundred MB/s anyway) and its the write performance on block level without a filesystem. With the overhead and complexitiy of a filesystem it is always way slower.
Good tool to run identical and comparable tests both on linux and win would be "fio".

Hire the fastest sprinter on earth to deliver a letter and you would wonder how slow he actually is when the destination address is not 2 blocks away but 40km in the next town while it is snowing...then it is totally pointless to know that he could run the 200m in 20 seconds if he then struggles after that and is only walking the remaining 39.8 km.
 
Last edited:
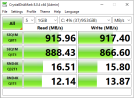
Yeah, good point. I restarted in Safe Mode, ran the same test and the results are:
1695947269635.png

It's been maybe 6 years since I last used fio but I did a fresh install of it and could not get it to output anything - not sure why. I even tried a job file, and didn't see any errors.

When inspecting the drivers and Storage controllers in Safe Mode and then after restarting in Normal Mode, they look the same. Windows drivers are being used both times. I'm looking into what else may have changed. Open to suggestions.
 
I found a better fio version which worked, this first one is Windows 10 normal mode. I am not sure what test would be most relevant but fio-rand-RW seemed like it might be:

>fio .\fio-rand-RW.fio
fio: this platform does not support process shared mutexes, forcing use of threads. Use the 'thread' option to get rid of this warning.
file1: (g=0): rw=randrw, bs=(R) 4096B-4096B, (W) 4096B-4096B, (T) 4096B-4096B, ioengine=windowsaio, iodepth=16
fio-3.35
Starting 1 thread
file1: Laying out IO file (1 file / 1024MiB)
Jobs: 1 (f=1): [m(1)][100.0%][r=19.1MiB/s,w=12.6MiB/s][r=4893,w=3213 IOPS][eta 00m:00s]
file1: (groupid=0, jobs=1): err= 0: pid=5256: Thu Sep 28 23:05:33 2023
read: IOPS=4462, BW=17.4MiB/s (18.3MB/s)(2092MiB/120001msec)
slat (nsec): min=900, max=50771k, avg=89806.75, stdev=401556.18
clat (nsec): min=300, max=100855k, avg=1139930.48, stdev=2326993.06
lat (usec): min=5, max=100977, avg=1229.74, stdev=2363.05
clat percentiles (usec):
| 1.00th=[ 104], 5.00th=[ 135], 10.00th=[ 233], 20.00th=[ 416],
| 30.00th=[ 586], 40.00th=[ 758], 50.00th=[ 938], 60.00th=[ 1106],
| 70.00th=[ 1287], 80.00th=[ 1467], 90.00th=[ 1663], 95.00th=[ 1860],
| 99.00th=[ 6325], 99.50th=[13960], 99.90th=[40109], 99.95th=[44827],
| 99.99th=[51119]
bw ( KiB/s): min= 7740, max=22693, per=100.00%, avg=17959.06, stdev=3323.69, samples=231
iops : min= 1935, max= 5673, avg=4489.49, stdev=830.91, samples=231
write: IOPS=2981, BW=11.6MiB/s (12.2MB/s)(1397MiB/120001msec); 0 zone resets
slat (nsec): min=900, max=53918k, avg=93103.04, stdev=492535.08
clat (nsec): min=300, max=101109k, avg=1137295.93, stdev=2282657.11
lat (usec): min=2, max=101947, avg=1230.40, stdev=2339.03
clat percentiles (usec):
| 1.00th=[ 104], 5.00th=[ 137], 10.00th=[ 233], 20.00th=[ 416],
| 30.00th=[ 586], 40.00th=[ 766], 50.00th=[ 938], 60.00th=[ 1106],
| 70.00th=[ 1287], 80.00th=[ 1467], 90.00th=[ 1663], 95.00th=[ 1860],
| 99.00th=[ 6194], 99.50th=[13829], 99.90th=[40109], 99.95th=[45351],
| 99.99th=[51119]
bw ( KiB/s): min= 5018, max=15696, per=100.00%, avg=11995.77, stdev=2180.70, samples=231
iops : min= 1254, max= 3924, avg=2998.65, stdev=545.16, samples=231
lat (nsec) : 500=0.01%, 750=0.01%, 1000=0.01%
lat (usec) : 2=0.01%, 4=0.01%, 10=0.01%, 20=0.46%, 50=0.11%
lat (usec) : 100=0.18%, 250=10.16%, 500=13.93%, 750=14.48%, 1000=14.23%
lat (msec) : 2=43.08%, 4=2.17%, 10=0.43%, 20=0.42%, 50=0.31%
lat (msec) : 100=0.01%, 250=0.01%
cpu : usr=4.17%, sys=86.67%, ctx=0, majf=0, minf=0
IO depths : 1=0.7%, 2=13.0%, 4=26.4%, 8=53.2%, 16=6.7%, 32=0.0%, >=64=0.0%
submit : 0=0.0%, 4=100.0%, 8=0.0%, 16=0.0%, 32=0.0%, 64=0.0%, >=64=0.0%
complete : 0=0.0%, 4=93.8%, 8=0.1%, 16=6.2%, 32=0.0%, 64=0.0%, >=64=0.0%
issued rwts: total=535553,357744,0,0 short=0,0,0,0 dropped=0,0,0,0
latency : target=0, window=0, percentile=100.00%, depth=16

Run status group 0 (all jobs):
READ: bw=17.4MiB/s (18.3MB/s), 17.4MiB/s-17.4MiB/s (18.3MB/s-18.3MB/s), io=2092MiB (2194MB), run=120001-120001msec
WRITE: bw=11.6MiB/s (12.2MB/s), 11.6MiB/s-11.6MiB/s (12.2MB/s-12.2MB/s), io=1397MiB (1465MB), run=120001-120001msec

>fio fio-rand-RW.fio
fio: this platform does not support process shared mutexes, forcing use of threads. Use the 'thread' option to get rid of this warning.
file1: (g=0): rw=randrw, bs=(R) 4096B-4096B, (W) 4096B-4096B, (T) 4096B-4096B, ioengine=windowsaio, iodepth=16
fio-3.35
fio: failed to create helper thread
Starting 1 thread

file1: (groupid=0, jobs=1): err= 0: pid=3204: Thu Sep 28 23:20:09 2023
read: IOPS=32.9k, BW=129MiB/s (135MB/s)(15.1GiB/120001msec)
slat (usec): min=5, max=3191, avg=16.52, stdev= 9.62
clat (nsec): min=300, max=3573.3k, avg=145642.99, stdev=85293.42
lat (usec): min=8, max=3900, avg=162.16, stdev=86.17
clat percentiles (usec):
| 1.00th=[ 15], 5.00th=[ 21], 10.00th=[ 36], 20.00th=[ 62],
| 30.00th=[ 89], 40.00th=[ 116], 50.00th=[ 143], 60.00th=[ 169],
| 70.00th=[ 196], 80.00th=[ 223], 90.00th=[ 258], 95.00th=[ 285],
| 99.00th=[ 338], 99.50th=[ 367], 99.90th=[ 453], 99.95th=[ 506],
| 99.99th=[ 1074]
write: IOPS=21.9k, BW=85.7MiB/s (89.9MB/s)(10.0GiB/120001msec); 0 zone resets
slat (usec): min=7, max=3325, avg=18.41, stdev= 9.93
clat (nsec): min=300, max=3537.7k, avg=145975.63, stdev=85357.42
lat (usec): min=8, max=3753, avg=164.38, stdev=86.24
clat percentiles (usec):
| 1.00th=[ 15], 5.00th=[ 21], 10.00th=[ 36], 20.00th=[ 63],
| 30.00th=[ 89], 40.00th=[ 116], 50.00th=[ 143], 60.00th=[ 169],
| 70.00th=[ 196], 80.00th=[ 225], 90.00th=[ 258], 95.00th=[ 285],
| 99.00th=[ 338], 99.50th=[ 367], 99.90th=[ 453], 99.95th=[ 506],
| 99.99th=[ 1123]
lat (nsec) : 500=0.01%, 750=0.01%, 1000=0.01%
lat (usec) : 2=0.01%, 4=0.01%, 10=0.16%, 20=4.61%, 50=10.68%
lat (usec) : 100=18.76%, 250=54.11%, 500=11.59%, 750=0.04%, 1000=0.01%
lat (msec) : 2=0.01%, 4=0.01%
cpu : usr=8.33%, sys=90.00%, ctx=0, majf=0, minf=0
IO depths : 1=0.1%, 2=12.9%, 4=26.7%, 8=53.6%, 16=6.7%, 32=0.0%, >=64=0.0%
submit : 0=0.0%, 4=100.0%, 8=0.0%, 16=0.0%, 32=0.0%, 64=0.0%, >=64=0.0%
complete : 0=0.0%, 4=93.7%, 8=0.1%, 16=6.3%, 32=0.0%, 64=0.0%, >=64=0.0%
issued rwts: total=3948148,2632521,0,0 short=0,0,0,0 dropped=0,0,0,0
latency : target=0, window=0, percentile=100.00%, depth=16

Run status group 0 (all jobs):
READ: bw=129MiB/s (135MB/s), 129MiB/s-129MiB/s (135MB/s-135MB/s), io=15.1GiB (16.2GB), run=120001-120001msec
WRITE: bw=85.7MiB/s (89.9MB/s), 85.7MiB/s-85.7MiB/s (89.9MB/s-89.9MB/s), io=10.0GiB (10.8GB), run=120001-120001msec
 
Last edited:

About

The Proxmox community has been around for many years and offers help and support for Proxmox VE, Proxmox Backup Server, and Proxmox Mail Gateway.
We think our community is one of the best thanks to people like you!

Get your subscription!

The Proxmox team works very hard to make sure you are running the best software and getting stable updates and security enhancements, as well as quick enterprise support. Tens of thousands of happy customers have a Proxmox subscription. Get yours easily in our online shop.

Buy now!