NVME Passthrough performance

dreamerdeciever

New Member
Feb 26, 2025
2
0
1
Hi, I am trialing proxmox on a server with an AMD EPYC 7313P, 256GB RAM and a bunch of enterprise SSDs. proxmox is version 8.3. I have an ubuntu 24.04 server vm setup with 16 cores and 128GB ram on a zfs mirror and was looking at passing through specific NVME disks to the vm.

I followed the pcie passthrough guide on the proxmox manual, all disks have their own IOMMU group and it seems to be passing through the devices. i have set up md raid 6 as a test however the performance i am getting is roughly half what i should be getting when i benchmark it. Wi

I am running the following command within the :
Code:
fio --name=random-write --ioengine=posixaio --rw=randwrite --bs=4k --size=4g --numjobs=1 --iodepth=1 --runtime=30 --time_based --end_fsync=1
what i get is
Code:
fio-3.36
Starting 1 process
Jobs: 1 (f=1): [F(1)][100.0%][eta 00m:00s]
random-write: (groupid=0, jobs=1): err= 0: pid=1934: Wed Feb 26 17:42:49 2025
  write: IOPS=27.2k, BW=106MiB/s (111MB/s)(3599MiB/33888msec); 0 zone resets
    slat (nsec): min=290, max=127712, avg=3629.94, stdev=1047.45
    clat (nsec): min=341, max=6047.3k, avg=27719.67, stdev=8519.02
     lat (usec): min=13, max=6049, avg=31.35, stdev= 8.84
    clat percentiles (usec):
     |  1.00th=[   20],  5.00th=[   21], 10.00th=[   22], 20.00th=[   23],
     | 30.00th=[   27], 40.00th=[   28], 50.00th=[   29], 60.00th=[   30],
     | 70.00th=[   30], 80.00th=[   31], 90.00th=[   32], 95.00th=[   34],
     | 99.00th=[   39], 99.50th=[   41], 99.90th=[   48], 99.95th=[   63],
     | 99.99th=[  130]
   bw (  KiB/s): min=69600, max=166784, per=100.00%, avg=125015.84, stdev=17021.67, samples=58
   iops        : min=17400, max=41696, avg=31253.98, stdev=4255.39, samples=58
  lat (nsec)   : 500=0.01%
  lat (usec)   : 10=0.01%, 20=1.32%, 50=98.60%, 100=0.07%, 250=0.01%
  lat (usec)   : 500=0.01%, 750=0.01%
  lat (msec)   : 4=0.01%, 10=0.01%
  cpu          : usr=15.03%, sys=15.43%, ctx=921689, majf=0, minf=26
  IO depths    : 1=100.0%, 2=0.0%, 4=0.0%, 8=0.0%, 16=0.0%, 32=0.0%, >=64=0.0%
     submit    : 0=0.0%, 4=100.0%, 8=0.0%, 16=0.0%, 32=0.0%, 64=0.0%, >=64=0.0%
     complete  : 0=0.0%, 4=100.0%, 8=0.0%, 16=0.0%, 32=0.0%, 64=0.0%, >=64=0.0%
     issued rwts: total=0,921327,0,0 short=0,0,0,0 dropped=0,0,0,0
     latency   : target=0, window=0, percentile=100.00%, depth=1

Run status group 0 (all jobs):
  WRITE: bw=106MiB/s (111MB/s), 106MiB/s-106MiB/s (111MB/s-111MB/s), io=3599MiB (3774MB), run=33888-33888msec

Disk stats (read/write):
    md5: ios=0/71269, sectors=0/8718896, merge=0/0, ticks=0/5248645, in_queue=5248645, util=29.11%, aggrios=32059/111531, aggsectors=10018186/6578892, aggrmerge=1220321/710840, aggrticks=16767/26859, aggrin_queue=43626, aggrutil=24.38%
  nvme0n1: ios=35775/107490, sectors=13224736/3499846, merge=1617502/329996, ticks=18434/22107, in_queue=40540, util=24.07%
  nvme3n1: ios=21416/122231, sectors=272232/15801182, merge=12613/1852943, ticks=10950/38091, in_queue=49041, util=24.01%
  nvme2n1: ios=35199/108476, sectors=13203920/3508550, merge=1615475/330098, ticks=18971/23929, in_queue=42901, util=24.37%
  nvme1n1: ios=35849/107928, sectors=13371856/3505990, merge=1635697/330326, ticks=18713/23309, in_queue=42022, util=24.38%

I have also tried with RAIDZ2 and get slightly worse performance, but not too far off this.

To rule out the disks, i tried the same (with the same array assmbled) on the host running a live ubuntu 24.04 server and on proxmox shell itself.

On both i installed, fio (also installed mdadm on proxmox) and reassmbled the array. on both of these i get roughly double the bandwidth, example from the proxmox shell is below
Code:
fio --name=random-write --ioengine=posixaio --rw=randwrite --bs=4k --size=4g --numjobs=1 --iodepth=1 --runtime=30 --time_based --end_fsync=1
random-write: (g=0): rw=randwrite, bs=(R) 4096B-4096B, (W) 4096B-4096B, (T) 4096B-4096B, ioengine=posixaio, iodepth=1
fio-3.33
Starting 1 process
Jobs: 1 (f=1): [w(1)][100.0%][eta 00m:00s]                        
random-write: (groupid=0, jobs=1): err= 0: pid=24896: Wed Feb 26 16:34:00 2025
  write: IOPS=59.3k, BW=232MiB/s (243MB/s)(8192MiB/35379msec); 0 zone resets
    slat (nsec): min=790, max=132992, avg=1003.29, stdev=384.63
    clat (usec): min=8, max=11558, avg=10.13, stdev=11.12
     lat (usec): min=9, max=11558, avg=11.14, stdev=11.17
    clat percentiles (usec):
     |  1.00th=[    9],  5.00th=[    9], 10.00th=[    9], 20.00th=[   10],
     | 30.00th=[   10], 40.00th=[   10], 50.00th=[   10], 60.00th=[   10],
     | 70.00th=[   11], 80.00th=[   11], 90.00th=[   13], 95.00th=[   14],
     | 99.00th=[   15], 99.50th=[   16], 99.90th=[   19], 99.95th=[   29],
     | 99.99th=[  108]
   bw (  KiB/s): min=97112, max=384440, per=100.00%, avg=342364.55, stdev=53617.78, samples=49
   iops        : min=24278, max=96110, avg=85591.12, stdev=13404.44, samples=49
  lat (usec)   : 10=63.03%, 20=36.90%, 50=0.04%, 100=0.02%, 250=0.01%
  lat (usec)   : 500=0.01%, 750=0.01%, 1000=0.01%
  lat (msec)   : 10=0.01%, 20=0.01%
  cpu          : usr=8.43%, sys=32.14%, ctx=2148402, majf=3, minf=23
  IO depths    : 1=100.0%, 2=0.0%, 4=0.0%, 8=0.0%, 16=0.0%, 32=0.0%, >=64=0.0%
     submit    : 0=0.0%, 4=100.0%, 8=0.0%, 16=0.0%, 32=0.0%, 64=0.0%, >=64=0.0%
     complete  : 0=0.0%, 4=100.0%, 8=0.0%, 16=0.0%, 32=0.0%, 64=0.0%, >=64=0.0%
     issued rwts: total=0,2097153,0,0 short=0,0,0,0 dropped=0,0,0,0
     latency   : target=0, window=0, percentile=100.00%, depth=1

Run status group 0 (all jobs):
  WRITE: bw=232MiB/s (243MB/s), 232MiB/s-232MiB/s (243MB/s-243MB/s), io=8192MiB (8590MB), run=35379-35379msec

Disk stats (read/write):
    md5: ios=1/315395, merge=0/0, ticks=0/11423629, in_queue=11423629, util=46.37%, aggrios=120512/244907, aggrmerge=1437231/1073551, aggrticks=29420/39073, aggrin_queue=68493, aggrutil=42.82%
  nvme0n1: ios=125186/240097, merge=1898156/641739, ticks=32633/35944, in_queue=68577, util=42.82%
  nvme3n1: ios=105733/258734, merge=45666/2368092, ticks=20498/47307, in_queue=67805, util=39.22%
  nvme2n1: ios=125330/240471, merge=1896070/642360, ticks=32357/36979, in_queue=69336, util=42.55%
  nvme1n1: ios=125801/240327, merge=1909034/642013, ticks=32192/36063, in_queue=68254, util=42.55%

is there anything i can do to get the perfomance out of these passthrough disks?

edit: i did a couple more tests
- created a raidz in proxmox
- gave the vm a scsi disk on the raidz
- gave the vm a block disk on the raidz
- ran the benchmarks again but this time with the fio commands listed in the CEPH benchmark PDF but with randwrite instead of just write

resuults were:
- slow md raid in the vm (around 30MB/s)
- virtual block device in the vm was slower (around 20MB/s)
- virtual scsi drive in the vm was even sower (around 15MB/s)
- single drive passthrough drive performance (around 170MB/s)
- raidz from proxmox shell (around 25 MB/s)
- single nvme drive from proxmox shell ( around 270MB/s)

so still would like to know why the passthrough disk is slow.


In the VM
 
Last edited:
ive done a lot of searching and still cant work out why there is such a big performance decrease when using pci passthrough to mount the nvme disks. ive made a lot of changes to the vm but none of them seem to make any difference. I can only think theres some cpu scheduling issue but asside from setting cpu affinity im not sure what else i can do.
 
DId you ever solve this problem? I am in the same boat, I have a PM1753 NVME disk with 600K write and 3.3M read IOPS, if I test it within proxmox itself with fio I get those IOPS, either as a rad device or mounted as XFS but if I do a passthrough to the VM performance goes down to around 180K iops for both read and write. I tried CPU affinity, mounting it as ext4 to the host and then adding a raw disk in the guest etc.... nothing changes. It is a 64 core single socket epyc cpu. Any ideas would be much appreciated.
 
Run this on the host to check which NUMA node each NVMe sits on:

for d in /sys/bus/pci/devices/*/nvme; do echo "$(dirname $d): NUMA $(cat $(dirname $d)/numa_node)"; done

Then check which NUMA node your vCPUs are pinned to -- if they don't match, that's your problem.

What CPU type is set on the VM -- is it host or something else?

What happens if you run the same fio test with --iodepth=32 instead of --iodepth=1?

Can you post the output of lspci -vvv for one of the NVMe devices from inside the VM and from the host so we can compare the link width?

What does cat /proc/interrupts | grep nvme look like inside the VM -- are the interrupts spread across cores or all landing on vCPU 0?

Is PCIe ASPM disabled in the guest -- check with cat /sys/module/pcie_aspm/parameters/policy and if it is not performance, try adding pcie_aspm=off to the guest kernel command line.

@gkuyuk that drop from 3.3M to 180K IOPS is bigger than normal VFIO overhead -- can you confirm your IOMMU groups are clean with find /sys/kernel/iommu_groups/ -type l and that each NVMe is in its own group?
 
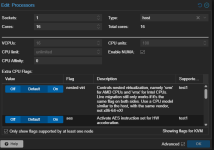
Here is the ouput for the affinity:

[I]root@test1:~# for d in /sys/bus/pci/devices/*/nvme; do echo "$(dirname $d): NUMA $(cat $(dirname $d)/numa_node)"; done[/I]
[I]/sys/bus/pci/devices/0000:c1:00.0: NUMA 0[/I]
/sys/bus/pci/devices/0000:c3:00.0: NUMA 0

I am running the fio test always with more than 4 workers and iodepth 256 (drive supports 512 but no difference), the performance goes up from 1 worker to 4 worker but does not really make much difference after 4 workers.
Here is the output of lspci -vvv (only the nvme part)

01:00.0 Non-Volatile memory controller: Samsung Electronics Co Ltd NVMe SSD Controller PM175x (prog-if 02 [NVM Express])
Subsystem: Samsung Electronics Co Ltd Device a8e4
Physical Slot: 0
Control: I/O- Mem+ BusMaster+ SpecCycle- MemWINV- VGASnoop- ParErr- Stepping- SERR+ FastB2B- DisINTx+
Status: Cap+ 66MHz- UDF- FastB2B- ParErr- DEVSEL=fast >TAbort- <TAbort- <MAbort- >SERR- <PERR- INTx-
Latency: 0, Cache Line Size: 64 bytes
Interrupt: pin A routed to IRQ 16
Region 0: Memory at fe800000 (64-bit, non-prefetchable) [size=32K]
Capabilities: [40] Power Management version 3
Flags: PMEClk- DSI- D1- D2- AuxCurrent=0mA PME(D0-,D1-,D2-,D3hot-,D3cold-)
Status: D0 NoSoftRst+ PME-Enable- DSel=0 DScale=0 PME-
Capabilities: [50] MSI: Enable- Count=1/32 Maskable- 64bit+
Address: 0000000000000000 Data: 0000
Capabilities: [70] Express (v2) Endpoint, IntMsgNum 0
DevCap: MaxPayload 512 bytes, PhantFunc 0, Latency L0s unlimited, L1 unlimited
ExtTag+ AttnBtn- AttnInd- PwrInd- RBE+ FLReset+ SlotPowerLimit 75W TEE-IO-
DevCtl: CorrErr+ NonFatalErr+ FatalErr+ UnsupReq+
RlxdOrd+ ExtTag+ PhantFunc- AuxPwr- NoSnoop+ FLReset-
MaxPayload 128 bytes, MaxReadReq 512 bytes
DevSta: CorrErr- NonFatalErr- FatalErr- UnsupReq- AuxPwr- TransPend-
LnkCap: Port #0, Speed 32GT/s, Width x4, ASPM not supported
ClockPM- Surprise- LLActRep- BwNot- ASPMOptComp+
LnkCtl: ASPM Disabled; RCB 64 bytes, LnkDisable- CommClk+
ExtSynch- ClockPM- AutWidDis- BWInt- AutBWInt-
LnkSta: Speed 32GT/s, Width x4
TrErr- Train- SlotClk+ DLActive- BWMgmt- ABWMgmt-
DevCap2: Completion Timeout: Range ABCD, TimeoutDis+ NROPrPrP- LTR-
10BitTagComp+ 10BitTagReq- OBFF Not Supported, ExtFmt- EETLPPrefix-
EmergencyPowerReduction Not Supported, EmergencyPowerReductionInit-
FRS- TPHComp- ExtTPHComp-
AtomicOpsCap: 32bit- 64bit- 128bitCAS-
DevCtl2: Completion Timeout: 50us to 50ms, TimeoutDis-
AtomicOpsCtl: ReqEn-
IDOReq- IDOCompl- LTR- EmergencyPowerReductionReq-
10BitTagReq- OBFF Disabled, EETLPPrefixBlk-
LnkCap2: Supported Link Speeds: 2.5-32GT/s, Crosslink- Retimer+ 2Retimers+ DRS-
LnkCtl2: Target Link Speed: 32GT/s, EnterCompliance- SpeedDis-
Transmit Margin: Normal Operating Range, EnterModifiedCompliance- ComplianceSOS-
Compliance Preset/De-emphasis: -6dB de-emphasis, 0dB preshoot
LnkSta2: Current De-emphasis Level: -6dB, EqualizationComplete+ EqualizationPhase1+
EqualizationPhase2+ EqualizationPhase3+ LinkEqualizationRequest-
Retimer- 2Retimers- CrosslinkRes: Upstream Port
Capabilities: [b0] MSI-X: Enable+ Count=256 Masked-
Vector table: BAR=0 offset=00004000
PBA: BAR=0 offset=00003000
Capabilities: [100 v2] Advanced Error Reporting
UESta: DLP- SDES- TLP- FCP- CmpltTO- CmpltAbrt- UnxCmplt- RxOF- MalfTLP-
ECRC- UnsupReq- ACSViol- UncorrIntErr- BlockedTLP- AtomicOpBlocked- TLPBlockedErr-
PoisonTLPBlocked- DMWrReqBlocked- IDECheck- MisIDETLP- PCRC_CHECK- TLPXlatBlocked-
UEMsk: DLP- SDES- TLP- FCP- CmpltTO- CmpltAbrt- UnxCmplt- RxOF- MalfTLP-
ECRC- UnsupReq+ ACSViol- UncorrIntErr- BlockedTLP- AtomicOpBlocked- TLPBlockedErr-
PoisonTLPBlocked- DMWrReqBlocked- IDECheck- MisIDETLP- PCRC_CHECK- TLPXlatBlocked-
UESvrt: DLP+ SDES+ TLP- FCP+ CmpltTO+ CmpltAbrt- UnxCmplt+ RxOF+ MalfTLP+
ECRC+ UnsupReq- ACSViol- UncorrIntErr+ BlockedTLP- AtomicOpBlocked- TLPBlockedErr-
PoisonTLPBlocked- DMWrReqBlocked- IDECheck- MisIDETLP- PCRC_CHECK- TLPXlatBlocked-
CESta: RxErr- BadTLP- BadDLLP- Rollover- Timeout- AdvNonFatalErr- CorrIntErr- HeaderOF-
CEMsk: RxErr- BadTLP- BadDLLP- Rollover- Timeout- AdvNonFatalErr- CorrIntErr- HeaderOF-
AERCap: First Error Pointer: 00, ECRCGenCap+ ECRCGenEn- ECRCChkCap+ ECRCChkEn-
MultHdrRecCap+ MultHdrRecEn- TLPPfxPres- HdrLogCap-
HeaderLog: 00000000 00000000 00000000 00000000
Capabilities: [148 v1] Device Serial Number 00-00-00-00-00-00-00-00
Kernel driver in use: nvme

[I] Kernel modules: nvme[/I]

interrupts:

[I][root@localhost ~]# cat /proc/interrupts | grep nvme[/I]
[I] 44: 0 0 0 0 23 0 0 0 PCI-MSIX-0000:01:00.0 0-edge nvme0q0[/I]
[I] 45: 4914505 0 0 0 0 0 0 0 PCI-MSIX-0000:01:00.0 1-edge nvme0q1[/I]
[I] 46: 0 4942957 0 0 0 0 0 0 PCI-MSIX-0000:01:00.0 2-edge nvme0q2[/I]
[I] 47: 0 0 4955561 0 0 0 0 0 PCI-MSIX-0000:01:00.0 3-edge nvme0q3[/I]
[I] 48: 0 0 0 4954897 0 0 0 0 PCI-MSIX-0000:01:00.0 4-edge nvme0q4[/I]
[I] 49: 0 0 0 0 4960387 0 0 0 PCI-MSIX-0000:01:00.0 5-edge nvme0q5[/I]
[I] 50: 0 0 0 0 0 4925932 0 0 PCI-MSIX-0000:01:00.0 6-edge nvme0q6[/I]
[I] 51: 0 0 0 0 0 0 4859997 0 PCI-MSIX-0000:01:00.0 7-edge nvme0q7[/I]
52: 0 0 0 0 0 0 0 4840344 PCI-MSIX-0000:01:00.0 8-edge nvme0q8

and the aspm output:

[I][root@localhost ~]# cat /sys/module/pcie_aspm/parameters/policy[/I]
[default] performance powersave powersupersave

Thank you in advance for taking the time to look at this.
 

Attachments

  • affinity.png
    affinity.png
    43.6 KB · Views: 0
  • pcipass.png
    pcipass.png
    20.7 KB · Views: 0
Here is the ouput for the affinity:

[I]root@test1:~# for d in /sys/bus/pci/devices/*/nvme; do echo "$(dirname $d): NUMA $(cat $(dirname $d)/numa_node)"; done[/I]
[I]/sys/bus/pci/devices/0000:c1:00.0: NUMA 0[/I]
/sys/bus/pci/devices/0000:c3:00.0: NUMA 0

I am running the fio test always with more than 4 workers and iodepth 256 (drive supports 512 but no difference), the performance goes up from 1 worker to 4 worker but does not really make much difference after 4 workers.
Here is the output of lspci -vvv (only the nvme part)

01:00.0 Non-Volatile memory controller: Samsung Electronics Co Ltd NVMe SSD Controller PM175x (prog-if 02 [NVM Express])
Subsystem: Samsung Electronics Co Ltd Device a8e4
Physical Slot: 0
Control: I/O- Mem+ BusMaster+ SpecCycle- MemWINV- VGASnoop- ParErr- Stepping- SERR+ FastB2B- DisINTx+
Status: Cap+ 66MHz- UDF- FastB2B- ParErr- DEVSEL=fast >TAbort- <TAbort- <MAbort- >SERR- <PERR- INTx-
Latency: 0, Cache Line Size: 64 bytes
Interrupt: pin A routed to IRQ 16
Region 0: Memory at fe800000 (64-bit, non-prefetchable) [size=32K]
Capabilities: [40] Power Management version 3
Flags: PMEClk- DSI- D1- D2- AuxCurrent=0mA PME(D0-,D1-,D2-,D3hot-,D3cold-)
Status: D0 NoSoftRst+ PME-Enable- DSel=0 DScale=0 PME-
Capabilities: [50] MSI: Enable- Count=1/32 Maskable- 64bit+
Address: 0000000000000000 Data: 0000
Capabilities: [70] Express (v2) Endpoint, IntMsgNum 0
DevCap: MaxPayload 512 bytes, PhantFunc 0, Latency L0s unlimited, L1 unlimited
ExtTag+ AttnBtn- AttnInd- PwrInd- RBE+ FLReset+ SlotPowerLimit 75W TEE-IO-
DevCtl: CorrErr+ NonFatalErr+ FatalErr+ UnsupReq+
RlxdOrd+ ExtTag+ PhantFunc- AuxPwr- NoSnoop+ FLReset-
MaxPayload 128 bytes, MaxReadReq 512 bytes
DevSta: CorrErr- NonFatalErr- FatalErr- UnsupReq- AuxPwr- TransPend-
LnkCap: Port #0, Speed 32GT/s, Width x4, ASPM not supported
ClockPM- Surprise- LLActRep- BwNot- ASPMOptComp+
LnkCtl: ASPM Disabled; RCB 64 bytes, LnkDisable- CommClk+
ExtSynch- ClockPM- AutWidDis- BWInt- AutBWInt-
LnkSta: Speed 32GT/s, Width x4
TrErr- Train- SlotClk+ DLActive- BWMgmt- ABWMgmt-
DevCap2: Completion Timeout: Range ABCD, TimeoutDis+ NROPrPrP- LTR-
10BitTagComp+ 10BitTagReq- OBFF Not Supported, ExtFmt- EETLPPrefix-
EmergencyPowerReduction Not Supported, EmergencyPowerReductionInit-
FRS- TPHComp- ExtTPHComp-
AtomicOpsCap: 32bit- 64bit- 128bitCAS-
DevCtl2: Completion Timeout: 50us to 50ms, TimeoutDis-
AtomicOpsCtl: ReqEn-
IDOReq- IDOCompl- LTR- EmergencyPowerReductionReq-
10BitTagReq- OBFF Disabled, EETLPPrefixBlk-
LnkCap2: Supported Link Speeds: 2.5-32GT/s, Crosslink- Retimer+ 2Retimers+ DRS-
LnkCtl2: Target Link Speed: 32GT/s, EnterCompliance- SpeedDis-
Transmit Margin: Normal Operating Range, EnterModifiedCompliance- ComplianceSOS-
Compliance Preset/De-emphasis: -6dB de-emphasis, 0dB preshoot
LnkSta2: Current De-emphasis Level: -6dB, EqualizationComplete+ EqualizationPhase1+
EqualizationPhase2+ EqualizationPhase3+ LinkEqualizationRequest-
Retimer- 2Retimers- CrosslinkRes: Upstream Port
Capabilities: [b0] MSI-X: Enable+ Count=256 Masked-
Vector table: BAR=0 offset=00004000
PBA: BAR=0 offset=00003000
Capabilities: [100 v2] Advanced Error Reporting
UESta: DLP- SDES- TLP- FCP- CmpltTO- CmpltAbrt- UnxCmplt- RxOF- MalfTLP-
ECRC- UnsupReq- ACSViol- UncorrIntErr- BlockedTLP- AtomicOpBlocked- TLPBlockedErr-
PoisonTLPBlocked- DMWrReqBlocked- IDECheck- MisIDETLP- PCRC_CHECK- TLPXlatBlocked-
UEMsk: DLP- SDES- TLP- FCP- CmpltTO- CmpltAbrt- UnxCmplt- RxOF- MalfTLP-
ECRC- UnsupReq+ ACSViol- UncorrIntErr- BlockedTLP- AtomicOpBlocked- TLPBlockedErr-
PoisonTLPBlocked- DMWrReqBlocked- IDECheck- MisIDETLP- PCRC_CHECK- TLPXlatBlocked-
UESvrt: DLP+ SDES+ TLP- FCP+ CmpltTO+ CmpltAbrt- UnxCmplt+ RxOF+ MalfTLP+
ECRC+ UnsupReq- ACSViol- UncorrIntErr+ BlockedTLP- AtomicOpBlocked- TLPBlockedErr-
PoisonTLPBlocked- DMWrReqBlocked- IDECheck- MisIDETLP- PCRC_CHECK- TLPXlatBlocked-
CESta: RxErr- BadTLP- BadDLLP- Rollover- Timeout- AdvNonFatalErr- CorrIntErr- HeaderOF-
CEMsk: RxErr- BadTLP- BadDLLP- Rollover- Timeout- AdvNonFatalErr- CorrIntErr- HeaderOF-
AERCap: First Error Pointer: 00, ECRCGenCap+ ECRCGenEn- ECRCChkCap+ ECRCChkEn-
MultHdrRecCap+ MultHdrRecEn- TLPPfxPres- HdrLogCap-
HeaderLog: 00000000 00000000 00000000 00000000
Capabilities: [148 v1] Device Serial Number 00-00-00-00-00-00-00-00
Kernel driver in use: nvme

[I] Kernel modules: nvme[/I]

interrupts:

[I][root@localhost ~]# cat /proc/interrupts | grep nvme[/I]
[I] 44: 0 0 0 0 23 0 0 0 PCI-MSIX-0000:01:00.0 0-edge nvme0q0[/I]
[I] 45: 4914505 0 0 0 0 0 0 0 PCI-MSIX-0000:01:00.0 1-edge nvme0q1[/I]
[I] 46: 0 4942957 0 0 0 0 0 0 PCI-MSIX-0000:01:00.0 2-edge nvme0q2[/I]
[I] 47: 0 0 4955561 0 0 0 0 0 PCI-MSIX-0000:01:00.0 3-edge nvme0q3[/I]
[I] 48: 0 0 0 4954897 0 0 0 0 PCI-MSIX-0000:01:00.0 4-edge nvme0q4[/I]
[I] 49: 0 0 0 0 4960387 0 0 0 PCI-MSIX-0000:01:00.0 5-edge nvme0q5[/I]
[I] 50: 0 0 0 0 0 4925932 0 0 PCI-MSIX-0000:01:00.0 6-edge nvme0q6[/I]
[I] 51: 0 0 0 0 0 0 4859997 0 PCI-MSIX-0000:01:00.0 7-edge nvme0q7[/I]
52: 0 0 0 0 0 0 0 4840344 PCI-MSIX-0000:01:00.0 8-edge nvme0q8

and the aspm output:

[I][root@localhost ~]# cat /sys/module/pcie_aspm/parameters/policy[/I]
[default] performance powersave powersupersave

Thank you in advance for taking the time to look at this.

Check your VM is on chipset Q35 if not change it to Q35.

Your lspci show your drive MaxPayload is 128 bytes at the moment but the drive supports 512. so lets add "pci=pcie_bus_perf" to the vm kernel command line


ASPM policy is default try setting it to performance or adding "pcie_aspm=off" to your guest VM kernel


also is your NVMe drive using 512e or 4kn as 512e generate more interrupts that inside a VM cause more user context switches.
 
Last edited:
  • Like
Reactions: leesteken
It is on q35 otherwise it dos not let me do pcie option on the passthrough. this last change did it.

Read Test:

Jobs: 32 (f=32): [R(32)][2.5%][r=9684MiB/s][r=2479k IOPS][eta 01m:57s]
Jobs: 32 (f=32): [R(32)][4.2%][r=9630MiB/s][r=2465k IOPS][eta 01m:55s]

[I]Jobbs: 32 (f=32): [R(32)][5.0%][r=9669MiB/s][r=2475k IOPS][eta 01m:54s][/I]

Write Test:

Jobs: 32 (f=32): [W(32)][2.5%][w=2001MiB/s][w=512k IOPS][eta 01m:57s]
Jobs: 32 (f=32): [W(32)][4.2%][w=2008MiB/s][w=514k IOPS][eta 01m:55s]
Jobs: 32 (f=32): [W(32)][5.8%][w=2030MiB/s][w=520k IOPS][eta 01m:53s]

[I]Jobs: 32 (f=32): [W(32)][6.7%][w=2038MiB/s][w=522k IOPS][eta 01m:52s][/I]

One thing to note though, to get these results I have to use the libaio engine.

Great help really appreciated it. Have a great day. WIsh i could buy you a coffee now.
 
Last edited:
It is on q35 otherwise it dos not let me do pcie option on the passthrough. this last change did it.

Read Test:

Jobs: 32 (f=32): [R(32)][2.5%][r=9684MiB/s][r=2479k IOPS][eta 01m:57s]
Jobs: 32 (f=32): [R(32)][4.2%][r=9630MiB/s][r=2465k IOPS][eta 01m:55s]

[I]Jobbs: 32 (f=32): [R(32)][5.0%][r=9669MiB/s][r=2475k IOPS][eta 01m:54s][/I]

Write Test:

Jobs: 32 (f=32): [W(32)][2.5%][w=2001MiB/s][w=512k IOPS][eta 01m:57s]
Jobs: 32 (f=32): [W(32)][4.2%][w=2008MiB/s][w=514k IOPS][eta 01m:55s]
Jobs: 32 (f=32): [W(32)][5.8%][w=2030MiB/s][w=520k IOPS][eta 01m:53s]

[I]Jobs: 32 (f=32): [W(32)][6.7%][w=2038MiB/s][w=522k IOPS][eta 01m:52s][/I]

Great help really appreciated it. Have a great day. WIsh i could buy you a coffee now.

"pcie_aspm=off" ??
 
That did not make much difference but "pci=pcie_bus_perf" this. For future reference to others:

1- CPU Type: Host and NUMA enabled
2- Check the nvme afinity and put it in CPU Affinity under CPU settings (---for d in /sys/bus/pci/devices/*/nvme; do echo "$(dirname $d): NUMA $(cat $(dirname $d)/numa_node)"; done[/I] ---)
2- Machine Type: q35
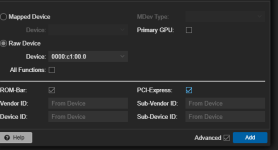
3- When doing PCI Passthrough make sure PCI-Express Checked (available only under q35 machine type)
4- Add kernel paramaters pcie_aspm=off and pci=pcie_bus_perf

Tested these again on a fresh almalinux guest vm and got the same results. All the credit goes to DamienDye.
 
Last edited: