we have an issue with nodes going red at pve web page for at least a week.
we've a 3 node cluster, all software up to date. corosync uses a separate network.
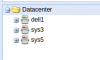
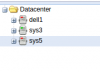
From pve web pages: every morning at least 2 of the nodes show the other noded red . usually one of the nodes show all green.
from cli pve status shows all OK at the 3 nodes.
the red issue can be fixed by running: /etc/init.d/pve-cluster restart
The network can get busy overnight with pve backups and other rsync cronjobs.
we have the red not issue now.
here is more information:
Multicast tests have been done and seem to be OK
As long as our vm's keep working I'll keep the nodes red in order to supply more information.
I've been checking syslog at each node and can not decipher what is causing the issue.
Any suggestions to try to get this fixed?
best regards, Rob Fantini
we've a 3 node cluster, all software up to date. corosync uses a separate network.
From pve web pages: every morning at least 2 of the nodes show the other noded red . usually one of the nodes show all green.
from cli pve status shows all OK at the 3 nodes.
the red issue can be fixed by running: /etc/init.d/pve-cluster restart
The network can get busy overnight with pve backups and other rsync cronjobs.
we have the red not issue now.
here is more information:
Code:
dell1  /var/log # cat /etc/pve/.members
{
"nodename": "dell1",
"version": 94,
"cluster": { "name": "cluster-v4", "version": 13, "nodes": 3, "quorate": 1 },
"nodelist": {
  "sys3": { "id": 1, "online": 1, "ip": "10.1.10.42"},
  "dell1": { "id": 3, "online": 1, "ip": "10.1.10.181"},
  "sys5": { "id": 4, "online": 1, "ip": "10.1.10.19"}
  }
}
Code:
dell1  ~ # pvecm status
Quorum information
------------------
Date:             Sun Nov 15 07:51:39 2015
Quorum provider:  corosync_votequorum
Nodes:            3
Node ID:          0x00000003
Ring ID:          11448
Quorate:          Yes

Votequorum information
----------------------
Expected votes:   3
Highest expected: 3
Total votes:      3
Quorum:           2
Flags:            Quorate

Membership information
----------------------
    Nodeid      Votes Name
0x00000004          1 10.2.8.19
0x00000001          1 10.2.8.42
0x00000003          1 10.2.8.181 (local)
Code:
dell1  ~ # pveversion -v
proxmox-ve: 4.0-21 (running kernel: 4.2.3-2-pve)
pve-manager: 4.0-57 (running version: 4.0-57/cc7c2b53)
pve-kernel-4.2.2-1-pve: 4.2.2-16
pve-kernel-4.2.3-1-pve: 4.2.3-18
pve-kernel-4.2.3-2-pve: 4.2.3-21
lvm2: 2.02.116-pve1
corosync-pve: 2.3.5-1
libqb0: 0.17.2-1
pve-cluster: 4.0-24
qemu-server: 4.0-35
pve-firmware: 1.1-7
libpve-common-perl: 4.0-36
libpve-access-control: 4.0-9
libpve-storage-perl: 4.0-29
pve-libspice-server1: 0.12.5-2
vncterm: 1.2-1
pve-qemu-kvm: 2.4-12
pve-container: 1.0-21
pve-firewall: 2.0-13
pve-ha-manager: 1.0-13
ksm-control-daemon: 1.2-1
glusterfs-client: 3.5.2-2+deb8u1
lxc-pve: 1.1.4-3
lxcfs: 0.10-pve2
cgmanager: 0.39-pve1
criu: 1.6.0-1
zfsutils: 0.6.5-pve6~jessie
Multicast tests have been done and seem to be OK
Code:
dell1  /etc # omping -c 10000 -i 0.001 -F -q  sys3-corosync sys5-corosync dell1-corosync
sys3-corosync : waiting for response msg
sys5-corosync : waiting for response msg
sys5-corosync : joined (S,G) = (*, 232.43.211.234), pinging
sys3-corosync : joined (S,G) = (*, 232.43.211.234), pinging
sys3-corosync : given amount of query messages was sent
sys5-corosync : given amount of query messages was sent

sys3-corosync :   unicast, xmt/rcv/%loss = 10000/10000/0%, min/avg/max/std-dev = 0.073/0.101/0.282/0.020
sys3-corosync : multicast, xmt/rcv/%loss = 10000/9993/0% (seq>=8 0%), min/avg/max/std-dev = 0.069/0.107/0.291/0.021
sys5-corosync :   unicast, xmt/rcv/%loss = 10000/10000/0%, min/avg/max/std-dev = 0.060/0.099/3.637/0.073
sys5-corosync : multicast, xmt/rcv/%loss = 10000/9993/0% (seq>=8 0%), min/avg/max/std-dev = 0.059/0.107/3.645/0.073

dell1  /etc # omping -c 600 -i 1 -q  sys3-corosync sys5-corosync dell1-corosync
sys3-corosync : waiting for response msg
sys5-corosync : waiting for response msg
sys3-corosync : waiting for response msg
sys5-corosync : waiting for response msg
sys5-corosync : joined (S,G) = (*, 232.43.211.234), pinging
sys3-corosync : joined (S,G) = (*, 232.43.211.234), pinging
sys3-corosync : given amount of query messages was sent
sys5-corosync : given amount of query messages was sent

sys3-corosync :   unicast, xmt/rcv/%loss = 600/600/0%, min/avg/max/std-dev = 0.108/0.251/0.382/0.035
sys3-corosync : multicast, xmt/rcv/%loss = 600/600/0%, min/avg/max/std-dev = 0.112/0.253/0.779/0.041
sys5-corosync :   unicast, xmt/rcv/%loss = 600/600/0%, min/avg/max/std-dev = 0.125/0.216/1.754/0.071
sys5-corosync : multicast, xmt/rcv/%loss = 600/600/0%, min/avg/max/std-dev = 0.116/0.210/1.762/0.067
As long as our vm's keep working I'll keep the nodes red in order to supply more information.
I've been checking syslog at each node and can not decipher what is causing the issue.
Any suggestions to try to get this fixed?
best regards, Rob Fantini
Last edited: