Node gets gray question marks on everything occasionally

kisalex

New Member
Nov 22, 2023
4
0
1
I currently run 3 proxmox nodes in a cluster, pve1 pve2 pve3. One of these nodes has been continuously causing issues for me, pve1.

The most relevant specs for pve1 are
- CPU: AMD Ryzen 7950X
- MEM: 2x 48 GB DDR5 (Corsair Vengeance DDR5-5600 BK C40 DC, datasheet available here)
- MOBO: ASRock B650M Pro RS WiFi (datasheet available here)


Introduction

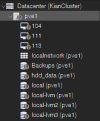
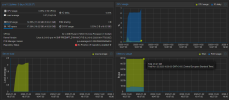
After creating this node, I noticed that after a few days of runtime it would eventually have all of its vms, containers and storages have a question mark, which also seemed to cut off the usage graphs for everything at the time of the event.

Even though this looked very wrong, the vms in question still seemed to function as they should as they were still fully responsive to ssh & web queries (for the ones running webservers) so I didn't think much of it. After a simple reboot the problem "went away" and everything was back to normal.

After a few days post-reboot, this time the entire node went down and became fully unreachable. It was still "on" in sort of a zombie mode where I could see it being connected via the router, the computer in question was on, but the node would not respond to pings, ssh requests and all of its vms were shut down; the only way to reboot it was by doing a physical hard shut off.
1700678197776.png
1700678220402.png


Initial analysis

After the second incident occurred on this same node I could no longer write it off as a coincidence and begun investigating the problem, only to find out this seems to be a rather "common" problem.

The first thing I looked into was if I had faulty ram, I was using the newest high capacity DDR5 ram sticks after all.


Memory test 1

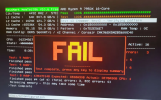
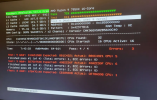
When investigating the memory by running memtest86 for the first time over the span of about 8 hours, multiple things were noted:
- There were a total of 3 issues that popped up, two of them on test 9
- The memory was running at its advertised speed of 5600MT/s, which upon further investigation is not supported by the Ryzen 7590x which only supports up to 5200MT/s
- My BIOS was "severely" updated, including an update specifically stating support for high capacity 48gb memory sticks

all of these factors contributed to the initial test failing.
1700678620524.png
1700678755038.png

Memory test 2

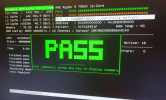
As the first test had failed and a ton of issues were noted as a result of my user error, I went ahead and updated the bios to officially support high capacity memory and downgraded their frequency to 4800, giving me some headroom below the officially supported speed of 5200 as stated by my processor's datasheet.

This second memory test ended up succeeding without any errors, implicating that the steps I had taken after the initial test resolved the issue.
1700678859116.png

The second incident

After having fixed the issues with my memory which were pretty major, I believed that was the root cause of both previous incidents and kept going.

However, as you might have guessed this isn't the end of it. A few days after rebooting the node and it operating successfully, I attempted to restore a 5gb vm backup located on the "Backups" hdd located on pve1 which then seemed to do absolutely nothing for 15 minutes.

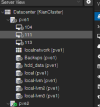
Shortly after stopping the backup as it was doing nothing, I deleted the server that had been incompletely created from said backup and re attempted the restoration, the result this time was that the entire node got the gray questionmark again, this time implying something else must be the problem and that my theory of the memory being the cause was incorrect.
1700679131516.png

Subsequent investigation​

Immediately after the entire node went "gray ?" after the memory issues were resolved I begun investigating, here is the data:

The tasks log displays both my attempts at backup restoration

1700679258690.png

A systemctl status pvestatd command indicated no errors

1700679285846.png

The hdd_data volume seems to be locked.
Code:
root@pve1:~# ls /var/lock/lvm
P_global  V_hdd_data

Running a systemctl restart pvestatd command removed the question mark from the vms themselves, but the storages and graphs were still down.
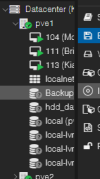
1700679463355.png

Running the pvesm status command froze completely, and shortly thereafter made the vms return into the question mark state
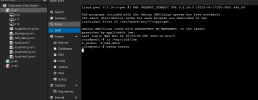
1700679521714.png

The journalctl -r command returned the following output, the initial crash occurred at around 18:39 based on where the graphs went down:

Link to the output on pastebin

[PART 1, I aim to give as much information as possible regarding steps I took and investigation]
 
[PART 2]

I noticed that in the journalctl, it was mentioned that sdb and sda appeared to increase their error rates, indicating that this may all be caused by a drive failure, further indicated by how the lvm lock showed that the hdd_data disk was locked after the grey question mark returned.

1700679704393.png

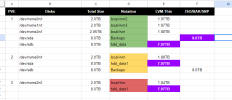
The following is an excel sheet where I show each node and which disk it uses, including its notation, capacity and type. The disks marked in purple were 4x 8tb disks that were purchased at the same time and likely come from the same batch.
1700679856458.png

Disks on pve1 as per the "Disks" section, showing that sda is an ext4 partition for isos and backups, and sdb is an LVM:
1700679915611.png

As PVE3 is currently down as it is the "main work machine" I use when I am at home (that gets dual booted into proxmox and becomes a part of the cluster as pve3 when I go traveling for extended periods), here are the RAID values for the 8tb disks on both pve1 and pve2:

HDD Raid Values​

pve1​

/dev/sda ->
Code:
ID# ATTRIBUTE_NAME          FLAG     VALUE WORST THRESH TYPE      UPDATED  WHEN_FAILED RAW_VALUE
  1 Raw_Read_Error_Rate     0x000f   084   064   044    Pre-fail  Always       -       225137118
  3 Spin_Up_Time            0x0003   088   088   000    Pre-fail  Always       -       0
  4 Start_Stop_Count        0x0032   100   100   020    Old_age   Always       -       7
  5 Reallocated_Sector_Ct   0x0033   100   100   010    Pre-fail  Always       -       0
  7 Seek_Error_Rate         0x000f   100   253   045    Pre-fail  Always       -       362429
  9 Power_On_Hours          0x0032   098   098   000    Old_age   Always       -       1870
 10 Spin_Retry_Count        0x0013   100   100   097    Pre-fail  Always       -       0
 12 Power_Cycle_Count       0x0032   100   100   020    Old_age   Always       -       7
 18 Head_Health             0x000b   100   100   050    Pre-fail  Always       -       0
187 Reported_Uncorrect      0x0032   100   100   000    Old_age   Always       -       0
188 Command_Timeout         0x0032   100   100   000    Old_age   Always       -       0
190 Airflow_Temperature_Cel 0x0022   061   056   040    Old_age   Always       -       39 (Min/Max 39/40)
192 Power-Off_Retract_Count 0x0032   100   100   000    Old_age   Always       -       2
193 Load_Cycle_Count        0x0032   099   099   000    Old_age   Always       -       3568
194 Temperature_Celsius     0x0022   039   044   000    Old_age   Always       -       39 (0 24 0 0 0)
195 Hardware_ECC_Recovered  0x001a   084   064   000    Old_age   Always       -       225137118
197 Current_Pending_Sector  0x0012   100   100   000    Old_age   Always       -       0
198 Offline_Uncorrectable   0x0010   100   100   000    Old_age   Offline      -       0
199 UDMA_CRC_Error_Count    0x003e   200   200   000    Old_age   Always       -       0
240 Head_Flying_Hours       0x0000   100   253   000    Old_age   Offline      -       42h+25m+18.948s
241 Total_LBAs_Written      0x0000   100   253   000    Old_age   Offline      -       213414974
242 Total_LBAs_Read         0x0000   100   253   000    Old_age   Offline      -       11722144

/dev/sdb ->
Code:
ID# ATTRIBUTE_NAME          FLAG     VALUE WORST THRESH TYPE      UPDATED  WHEN_FAILED RAW_VALUE
  1 Raw_Read_Error_Rate     0x000f   084   064   006    Pre-fail  Always       -       237285555
  3 Spin_Up_Time            0x0003   093   091   000    Pre-fail  Always       -       0
  4 Start_Stop_Count        0x0032   100   100   020    Old_age   Always       -       650
  5 Reallocated_Sector_Ct   0x0033   100   100   010    Pre-fail  Always       -       0
  7 Seek_Error_Rate         0x000f   071   060   045    Pre-fail  Always       -       13907514
  9 Power_On_Hours          0x0032   097   097   000    Old_age   Always       -       3464h+43m+18.887s
 10 Spin_Retry_Count        0x0013   100   100   097    Pre-fail  Always       -       0
 12 Power_Cycle_Count       0x0032   100   100   020    Old_age   Always       -       152
183 Runtime_Bad_Block       0x0032   100   100   000    Old_age   Always       -       0
184 End-to-End_Error        0x0032   100   100   099    Old_age   Always       -       0
187 Reported_Uncorrect      0x0032   100   100   000    Old_age   Always       -       0
188 Command_Timeout         0x0032   100   100   000    Old_age   Always       -       0 0 0
189 High_Fly_Writes         0x003a   100   100   000    Old_age   Always       -       0
190 Airflow_Temperature_Cel 0x0022   063   059   040    Old_age   Always       -       37 (Min/Max 37/39)
191 G-Sense_Error_Rate      0x0032   100   100   000    Old_age   Always       -       0
192 Power-Off_Retract_Count 0x0032   100   100   000    Old_age   Always       -       53
193 Load_Cycle_Count        0x0032   099   099   000    Old_age   Always       -       3873
194 Temperature_Celsius     0x0022   037   041   000    Old_age   Always       -       37 (0 23 0 0 0)
195 Hardware_ECC_Recovered  0x001a   084   064   000    Old_age   Always       -       237285555
197 Current_Pending_Sector  0x0012   100   100   000    Old_age   Always       -       0
198 Offline_Uncorrectable   0x0010   100   100   000    Old_age   Offline      -       0
199 UDMA_CRC_Error_Count    0x003e   200   200   000    Old_age   Always       -       0
240 Head_Flying_Hours       0x0000   100   253   000    Old_age   Offline      -       3000h+26m+41.953s
241 Total_LBAs_Written      0x0000   100   253   000    Old_age   Offline      -       1499232810
242 Total_LBAs_Read         0x0000   100   253   000    Old_age   Offline      -       2054641539

pve2​

/dev/sda ->
Code:
ID# ATTRIBUTE_NAME          FLAG     VALUE WORST THRESH TYPE      UPDATED  WHEN_FAILED RAW_VALUE
  1 Raw_Read_Error_Rate     0x000f   082   064   044    Pre-fail  Always       -       145409624
  3 Spin_Up_Time            0x0003   098   098   000    Pre-fail  Always       -       0
  4 Start_Stop_Count        0x0032   100   100   020    Old_age   Always       -       1
  5 Reallocated_Sector_Ct   0x0033   100   100   010    Pre-fail  Always       -       0
  7 Seek_Error_Rate         0x000f   069   060   045    Pre-fail  Always       -       7224984
  9 Power_On_Hours          0x0032   098   098   000    Old_age   Always       -       1874
 10 Spin_Retry_Count        0x0013   100   100   097    Pre-fail  Always       -       0
 12 Power_Cycle_Count       0x0032   100   100   020    Old_age   Always       -       1
 18 Head_Health             0x000b   100   100   050    Pre-fail  Always       -       0
187 Reported_Uncorrect      0x0032   100   100   000    Old_age   Always       -       0
188 Command_Timeout         0x0032   100   100   000    Old_age   Always       -       0
190 Airflow_Temperature_Cel 0x0022   063   057   040    Old_age   Always       -       37 (Min/Max 25/43)
192 Power-Off_Retract_Count 0x0032   100   100   000    Old_age   Always       -       1
193 Load_Cycle_Count        0x0032   100   100   000    Old_age   Always       -       89
194 Temperature_Celsius     0x0022   037   043   000    Old_age   Always       -       37 (0 25 0 0 0)
195 Hardware_ECC_Recovered  0x001a   082   064   000    Old_age   Always       -       145409624
197 Current_Pending_Sector  0x0012   100   100   000    Old_age   Always       -       0
198 Offline_Uncorrectable   0x0010   100   100   000    Old_age   Offline      -       0
199 UDMA_CRC_Error_Count    0x003e   200   200   000    Old_age   Always       -       0
240 Head_Flying_Hours       0x0000   100   253   000    Old_age   Offline      -       1863h+48m+18.080s
241 Total_LBAs_Written      0x0000   100   253   000    Old_age   Offline      -       2480576703
242 Total_LBAs_Read         0x0000   100   253   000    Old_age   Offline      -       2547655637

/dev/sdb ->
Code:
ID# ATTRIBUTE_NAME          FLAG     VALUE WORST THRESH TYPE      UPDATED  WHEN_FAILED RAW_VALUE
  1 Raw_Read_Error_Rate     0x000f   083   067   044    Pre-fail  Always       -       221231605
  3 Spin_Up_Time            0x0003   098   098   000    Pre-fail  Always       -       0
  4 Start_Stop_Count        0x0032   100   100   020    Old_age   Always       -       1
  5 Reallocated_Sector_Ct   0x0033   100   100   010    Pre-fail  Always       -       0
  7 Seek_Error_Rate         0x000f   100   253   045    Pre-fail  Always       -       318003
  9 Power_On_Hours          0x0032   098   098   000    Old_age   Always       -       1874
 10 Spin_Retry_Count        0x0013   100   100   097    Pre-fail  Always       -       0
 12 Power_Cycle_Count       0x0032   100   100   020    Old_age   Always       -       1
 18 Head_Health             0x000b   100   100   050    Pre-fail  Always       -       0
187 Reported_Uncorrect      0x0032   100   100   000    Old_age   Always       -       0
188 Command_Timeout         0x0032   100   100   000    Old_age   Always       -       0
190 Airflow_Temperature_Cel 0x0022   058   052   040    Old_age   Always       -       42 (Min/Max 24/48)
192 Power-Off_Retract_Count 0x0032   100   100   000    Old_age   Always       -       1
193 Load_Cycle_Count        0x0032   099   099   000    Old_age   Always       -       3695
194 Temperature_Celsius     0x0022   042   048   000    Old_age   Always       -       42 (0 24 0 0 0)
195 Hardware_ECC_Recovered  0x001a   083   067   000    Old_age   Always       -       221231605
197 Current_Pending_Sector  0x0012   100   100   000    Old_age   Always       -       0
198 Offline_Uncorrectable   0x0010   100   100   000    Old_age   Offline      -       0
199 UDMA_CRC_Error_Count    0x003e   200   200   000    Old_age   Always       -       0
240 Head_Flying_Hours       0x0000   100   253   000    Old_age   Offline      -       38h+25m+14.453s
241 Total_LBAs_Written      0x0000   100   253   000    Old_age   Offline      -       221137958
242 Total_LBAs_Read         0x0000   100   253   000    Old_age   Offline      -       93647

The questions​

I believe that the raid values may indicate everything is happening as a result of one (or multiple) of these disks being the point of failure which leads to the questions:
- How should I proceed?
- Am I "correct" in my theory of the disks being the issue?
- Are there any other tests I should perform?

Apologies if this was a bit long, I wanted to document as much of it as possible for the next person that faces this issue so they may see if this situation applies to them.
 
Upon further investigation and the help of this stackexchange thread that explains how to interpret part of the S.M.A.R.T values, it turns out that in some cases one number represent more than one thing. In the case of pve1 this means that


Code:
PVE1
/dev/sda
    Raw_Read_Error_Rate 225137118
        Operations      225137118
        Errors          0
    Seek_Error_Rate     362429
        Operations      362429
        Errors          0
/dev/sdb
    Raw_Read_Error_Rate 237285555
        Operations      237285555
        Errors          0
    Seek_Error_Rate     13907514
        Operations      13907514
        Errors          0

So somehow, the errors indicated by S.M.A.R.T is 0 in terms of Raw_Read_Error_Rate and Seek_Error_Rate which then has me even more confused as to what the problem is
 
Last edited:
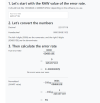
Further investigation seems to indicate that while the bitwise calculations demonstrate that the "true" error rate is 0, the "Normalized" error rate is well beyond 0:
1700740977289.png
 

About

The Proxmox community has been around for many years and offers help and support for Proxmox VE, Proxmox Backup Server, and Proxmox Mail Gateway.
We think our community is one of the best thanks to people like you!

Get your subscription!

The Proxmox team works very hard to make sure you are running the best software and getting stable updates and security enhancements, as well as quick enterprise support. Tens of thousands of happy customers have a Proxmox subscription. Get yours easily in our online shop.

Buy now!