[SOLVED] Node Capacity / Memory - can I add more VM's or is it full?

drjaymz@

Member
Jan 19, 2022
124
5
23
102
A question I have had for a while and never got around to asking:

I have many Proxmox clusters which usually contain 3 nodes, Xeon 128Gb SSD. What I don't really have a feel for is what capacity those nodes have for the number of concurrent VM/containers.
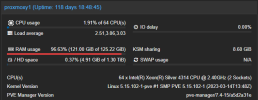
As an example I migrated 6 VM's which are between 4 and 8Gb RAM from a KVM server which only had 64Gb of RAM (which was never fully used) and on proxmox I see the RAM is pegged to 96% after a few weeks of running. There's no performance issue but I expected that node to be able to handle double that workload. If I spin up a new VM and give it 16 Gb of RAM the memory of the node stays ay around 96% and then if I destroy that VM it drops a bit before coming back. I assume then its basically caching with all available unused RAM - which is a good thing,

If I run free it seems to show that it really is using all that RAM with what it thinks is a tiny buffer.
Code:
root@proxmoxy3:~# free -h
               total        used        free      shared  buff/cache   available
Mem:           125Gi       119Gi       4.1Gi        66Mi       1.1Gi       5.3Gi
Swap:             0B          0B          0B

1697093577094.png

Of course, in the interest of HA, the next problem is that provision on 3 nodes needs to run on 2 nodes at least temporarily otherwise HA can't work.

This node has twice as many CPU's, Memory and Disk than it previously had but I am not sure if I can actually add more workload to it.
Disk usage is moderate and CPU load is very low. Network IO is low and replication is on its own 10Gbit connection where 1Gbit would have been ample.

So... I don't know how to read memory usage. All that said, I don't think I have ever tried to migrate everything or start lots and see what happens, it just tends to run them fine.
I've seen others running dozens of VM's
 
No one can answer this, because "it depends".

Due to kernel samepage merging (KSM) you can run almost identical VMs with deduplicated memory and therefore pack your server much tighter than with totally disjuct VMs. It also depends on how you use the memory itself, e.g. LX(C) containers do NOT share memory (for security reasons) based on their disjunct cgroups.

If you set too much memory to your VMs, the RAM is used for caching inside of your VMs and cannot be used for anything else, hence leading to a high RAM usage on your host. You have to balance e.g. caching inside of your VM and caching outside (e.g. in ZFS ARC), which could lead to double or tripple caching which is good for performance (to some extend), but will waste a lot of memory.

Yeah I was afraid the answer would be a question. Well, memory is cheap. As in doubling the RAM is peanuts compared with adding a complete new node.

So what happens if I actually run out of RAM? For some reason across hundreds of VM's and dozens of nodes including on non- server hardware I don't think ever had out of memory issue. I perhaps should have tried that.

Containers don't share RAM - is true but not the whole story because I understand the RAM configured is a limit rather than an allocation. So I could have 10 containers configured to use 64Gb of RAM each but that would unlikely use 640Gb of host RAM. If I understood it right then for VM's the memory pages that are identical between running VM's can be de-duplicated which is shown as KSM although I don't know what 8.6 actually means if that is how much its saved by de-duplicating or how much page space is used more than once - nobody knows or cares because you cant' use that information:

1697099075012.png

And then finally one can go on the command line and try any number of tools to show what the ram is actually doing and its not helpful because none of them agree.

Free - roughly shows what is above although it doesn't match and nobody knows why as they are both hitting some metrics in /proc
top - doesn't agree with either but shows that RAM is mostly used appears to show the same as Free but doesn't actually add up.

but both of these tools think its 1974 - so they basically state that all your RAM is doing "something".

htop - says that actually you're using about half for actual "something" and the rest is cache.

1697099457284.png

I believe htop. Because its also able to show me all the processes and memory usage therein of all the processes running inside the containers and even show them in a nice tree.
Its also a bonus to show DIsk IO and Network IO per process and as a whole. great tool.

So in summary nobody can answer the question, but the suspicion that its suggesting your using all your RAM but actually you aren't its just filling it with cache appears to be correct.

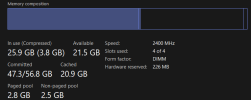
Here's how windows has done it thanks to Dave P for a couple of decades:

1697100073337.png

Which is more or less the same as the Mac does it and htop. Proxmox has a gui - but its a c- gui, needs to try harder.

-James
 

Attachments

  • 1697099339341.png
    1697099339341.png
    24.3 KB · Views: 1
Containers don't share RAM - is true but not the whole story because I understand the RAM configured is a limit rather than an allocation. So I could have 10 containers configured to use 64Gb of RAM each but that would unlikely use 640Gb of host RAM.
Yes, that is true. The cache is shared with the host, so you've a problem there with respect to limiting cache.

If I understood it right then for VM's the memory pages that are identical between running VM's can be de-duplicated which is shown as KSM although I don't know what 8.6 actually means if that is how much its saved by de-duplicating or how much page space is used more than once - nobody knows or cares because you cant' use that information:
The 8.6 GB means that without KSM, you would need 8.6 GB more RAM in order to run the same workload.


And then finally one can go on the command line and try any number of tools to show what the ram is actually doing and its not helpful because none of them agree.
Yes, that's the big problem. All tools interpret the data differently, because they don't know either. If you look close, memory is EXTREMLY complicated. If you factor in ZFS, fragmentation and hugepages, it gets even harder.


I believe htop. Because its also able to show me all the processes and memory usage therein of all the processes running inside the containers and even show them in a nice tree.
Its also a bonus to show DIsk IO and Network IO per process and as a whole. great tool.
Yes. I concur. Just look at the "green" bar and you're fine.


Proxmox has a gui - but its a c- gui, needs to try harder.
Yes, there is a long disussion on the bugtracker about it.
 

I asked AI to summarise and I agree with the thread and what you said. So the green bar on HTOP *IS* the best guess.
I can see the argument in the thread that cache is used memory but forgets the cache is disposable, it is meaningless and might was well be a png showing 100%. None of that is any use to the user. What they want to know is can I run more workload or not? And the answer is the same as can I take on another task at work, probably, but everything else is affected in a complicated way and I might do a half-assed job for some of the tasks. When it comes to GUI design its not an easy thing. Some just want to show everything that the CLI shows or have everything shown at once - you don't. Its like a car dashboard you have a light showing low oil pressure not a complete analysis of the oil content and engine wear on every moving surface. Anyway - my takaway from this is that my question wasn't a stupid question and I now have a better idea that actually my node is probably about 50% of its capacity and I could increase the workload and might want to keep an eye on the HTOP graph.

The discussion revolves around the representation of memory usage in the Proxmox VE (PVE) Manager, particularly regarding how OS buffers, caches, and ZFS ARC cache are factored into the reported memory usage. The current method seemingly inflates the memory usage, making it hard to decipher the actual memory available for new VMs. The reporter suggests modifying the memory usage representation to provide a clearer picture of memory allocation, similar to how the /usr/bin/free utility displays memory usage.

A debate ensues over the complexity of memory usage representation, with some agreeing that a clearer distinction of cache and actual used memory could reduce confusion among users. Others argue that the intricacies of memory usage, especially with the inclusion of ZFS ARC cache, make it challenging to encapsulate in a simple graph, but acknowledge that the current representation can mislead users into thinking their memory is fully occupied, deterring them from starting new VMs.

Some suggestions include a multi-colored memory bar to differentiate between different memory utilizations, and the inclusion of more detailed metrics such as minimum, current, and maximum ARC, although there's concern that too much detail could overwhelm beginners. It's acknowledged that while advanced users might benefit from detailed metrics, newcomers might find it confusing. The discussion also touches on the inconsistencies between memory reporting on Windows and Linux VMs within PVE, and the desire for a more standardized, user-friendly, and informative memory usage representation.
 
Anyway - my takaway from this is that my question wasn't a stupid question and I now have a better idea that actually my node is probably about 50% of its capacity and I could increase the workload and might want to keep an eye on the HTOP graph.
A good indicator is always the swap-in/swap-out rate, yet you have not configured swap, therefore you cannot use this. Try using swap - at least zram (compressed swap in memory) in order to have more wiggle-room.
 

About

The Proxmox community has been around for many years and offers help and support for Proxmox VE, Proxmox Backup Server, and Proxmox Mail Gateway.
We think our community is one of the best thanks to people like you!

Get your subscription!

The Proxmox team works very hard to make sure you are running the best software and getting stable updates and security enhancements, as well as quick enterprise support. Tens of thousands of happy customers have a Proxmox subscription. Get yours easily in our online shop.

Buy now!