Network optimization for ceph.

plastilin

Renowned Member
Oct 9, 2012
99
5
73
Ukraine
For several weeks now, I've been struggling to improve the performance of ceph on 3 nodes. Each node has 4 disks of 6 TB. + one NVME 1 TB where Rocksdb / Wal are taken out. I can't seem to get ceph to run fast enough.

Below are my config files and test results:

pveversion -v

Code:
proxmox-ve: 7.4-1 (running kernel: 5.15.107-2-pve)
pve-manager: 7.4-3 (running version: 7.4-3/9002ab8a)
pve-kernel-5.15: 7.4-3
pve-kernel-5.15.107-2-pve: 5.15.107-2
ceph: 17.2.6-pve1
ceph-fuse: 17.2.6-pve1
corosync: 3.1.7-pve1
criu: 3.15-1+pve-1
glusterfs-client: 9.2-1
ifupdown2: 3.1.0-1+pmx4
ksm-control-daemon: 1.4-1
libjs-extjs: 7.0.0-1
libknet1: 1.24-pve2
libproxmox-acme-perl: 1.4.4
libproxmox-backup-qemu0: 1.3.1-1
libproxmox-rs-perl: 0.2.1
libpve-access-control: 7.4-3
libpve-apiclient-perl: 3.2-1
libpve-common-perl: 7.4-1
libpve-guest-common-perl: 4.2-4
libpve-http-server-perl: 4.2-3
libpve-rs-perl: 0.7.6
libpve-storage-perl: 7.4-2
libspice-server1: 0.14.3-2.1
lvm2: 2.03.11-2.1
lxc-pve: 5.0.2-2
lxcfs: 5.0.3-pve1
novnc-pve: 1.4.0-1
openvswitch-switch: 2.15.0+ds1-2+deb11u4
proxmox-backup-client: 2.4.2-1
proxmox-backup-file-restore: 2.4.2-1
proxmox-kernel-helper: 7.4-1
proxmox-mail-forward: 0.1.1-1
proxmox-mini-journalreader: 1.3-1
proxmox-widget-toolkit: 3.7.0
pve-cluster: 7.3-3
pve-container: 4.4-3
pve-docs: 7.4-2
pve-edk2-firmware: 3.20230228-2
pve-firewall: 4.3-2
pve-firmware: 3.6-5
pve-ha-manager: 3.6.1
pve-i18n: 2.12-1
pve-qemu-kvm: 7.2.0-8
pve-xtermjs: 4.16.0-1
qemu-server: 7.4-3
smartmontools: 7.2-pve3
spiceterm: 3.2-2
swtpm: 0.8.0~bpo11+3
vncterm: 1.7-1
zfsutils-linux: 2.1.11-pve1

ceph.conf

Code:
[global]

         auth_client_required = cephx
         auth_cluster_required = cephx
         auth_service_required = cephx
         cluster_network = 10.50.251.0/24
         fsid = 7d00b675-2f1e-47ff-a71c-b95d1745bc39
         mon_allow_pool_delete = true
         mon_host = 10.50.250.1 10.50.250.2 10.50.250.3
         ms_bind_ipv4 = true
         ms_bind_ipv6 = false
         osd_pool_default_min_size = 2
         osd_pool_default_size = 3
         public_network = 10.50.250.0/24
[client]

         keyring = /etc/pve/priv/$cluster.$name.keyring
[mon.nd01]
         public_addr = 10.50.250.1
[mon.nd02]
         public_addr = 10.50.250.2
[mon.nd03]
         public_addr = 10.50.250.3

crushmap

Code:
# begin crush map
tunable choose_local_tries 0
tunable choose_local_fallback_tries 0
tunable choose_total_tries 50
tunable chooseleaf_descend_once 1
tunable chooseleaf_vary_r 1
tunable chooseleaf_stable 1
tunable straw_calc_version 1
tunable allowed_bucket_algs 54

# devices

device 0 osd.0 class hdd
device 1 osd.1 class hdd
device 2 osd.2 class hdd
device 3 osd.3 class hdd
device 4 osd.4 class hdd
device 5 osd.5 class hdd
device 6 osd.6 class hdd
device 7 osd.7 class hdd
device 8 osd.8 class hdd
device 9 osd.9 class hdd
device 10 osd.10 class hdd
device 11 osd.11 class hdd

# types

type 0 osd
type 1 host
type 2 chassis
type 3 rack
type 4 row
type 5 pdu
type 6 pod
type 7 room
type 8 datacenter
type 9 zone
type 10 region
type 11 root

# buckets

host nd01 {
    id -3        # do not change unnecessarily
    id -2 class hdd        # do not change unnecessarily
    id -9 class nvme        # do not change unnecessarily
    # weight 22.70319
    alg straw2
    hash 0    # rjenkins1
    item osd.0 weight 5.67580
    item osd.1 weight 5.67580
    item osd.2 weight 5.67580
    item osd.3 weight 5.67580
}

host nd02 {
    id -5        # do not change unnecessarily
    id -4 class hdd        # do not change unnecessarily
    id -10 class nvme        # do not change unnecessarily
    # weight 22.70319
    alg straw2
    hash 0    # rjenkins1
    item osd.4 weight 5.67580
    item osd.5 weight 5.67580
    item osd.6 weight 5.67580
    item osd.7 weight 5.67580
}

host nd03 {
    id -7        # do not change unnecessarily
    id -6 class hdd        # do not change unnecessarily
    id -11 class nvme        # do not change unnecessarily
    # weight 22.70319
    alg straw2
    hash 0    # rjenkins1
    item osd.8 weight 5.67580
    item osd.9 weight 5.67580
    item osd.10 weight 5.67580
    item osd.11 weight 5.67580
}

root default {
    id -1        # do not change unnecessarily
    id -8 class hdd        # do not change unnecessarily
    id -12 class nvme        # do not change unnecessarily
    # weight 68.10956
    alg straw2
    hash 0    # rjenkins1
    item nd01 weight 22.70319
    item nd02 weight 22.70319
    item nd03 weight 22.70319
}

# rules

rule replicated_rule {
    id 0
    type replicated
    step take default
    step chooseleaf firstn 0 type host
    step emit
}
# end crush map

interfaces

Code:
auto lo
iface lo inet loopback

auto eno1
iface eno1 inet manual
        mtu 9216

auto eno2
iface eno2 inet manual
        mtu 9216

auto mgmt
iface mgmt inet static
        address 10.50.253.1/24
        gateway 10.50.253.254
        ovs_type OVSIntPort
        ovs_bridge vmbr0

auto cluster
iface cluster inet static
        address 10.50.252.1/24
        ovs_type OVSIntPort
        ovs_bridge vmbr0
        ovs_mtu 9000
        ovs_options tag=4043

auto cephcluster
iface cephcluster inet static
        address 10.50.251.1/24
        ovs_type OVSIntPort
        ovs_bridge vmbr0
        ovs_mtu 9000
        ovs_options tag=4045

auto cephpublic
iface cephpublic inet static
        address 10.50.250.1/24
        ovs_type OVSIntPort
        ovs_bridge vmbr0
        ovs_mtu 9000
        ovs_options tag=4053

auto bond0

iface bond0 inet manual
        ovs_bonds eno1 eno2
        ovs_type OVSBond
        ovs_bridge vmbr0
        ovs_mtu 9216
        ovs_options lacp=active bond_mode=balance-tcp

auto vmbr0
iface vmbr0 inet manual
        ovs_type OVSBridge
        ovs_ports bond0 mgmt cluster cephcluster cephpublic
        ovs_mtu 9216

hdparm -tT --direct /dev/sdX

Code:
/dev/sda:
 Timing O_DIRECT cached reads:   864 MB in  2.00 seconds = 431.80 MB/sec
SG_IO: bad/missing sense data, sb[]:  72 05 20 00 00 00 00 1c 02 06 00 00 cf 00 00 00 03 02 00 01 80 0e 00 00 00 00 00 00 00 00 00 00
 Timing O_DIRECT disk reads: 738 MB in  3.00 seconds = 245.60 MB/sec

/dev/sdb:
 Timing O_DIRECT cached reads:   856 MB in  2.00 seconds = 427.35 MB/sec
SG_IO: bad/missing sense data, sb[]:  72 05 20 00 00 00 00 1c 02 06 00 00 cf 00 00 00 03 02 00 01 80 0e 00 00 00 00 00 00 00 00 00 00
 Timing O_DIRECT disk reads: 770 MB in  3.01 seconds = 256.21 MB/sec

/dev/sdc:
 Timing O_DIRECT cached reads:   868 MB in  2.00 seconds = 434.24 MB/sec
SG_IO: bad/missing sense data, sb[]:  72 05 20 00 00 00 00 1c 02 06 00 00 cf 00 00 00 03 02 00 01 80 0e 00 00 00 00 00 00 00 00 00 00
 Timing O_DIRECT disk reads: 752 MB in  3.00 seconds = 250.44 MB/sec

/dev/sdd:
 Timing O_DIRECT cached reads:   860 MB in  2.00 seconds = 429.65 MB/sec
SG_IO: bad/missing sense data, sb[]:  72 05 20 00 00 00 00 1c 02 06 00 00 cf 00 00 00 03 02 00 01 80 0e 00 00 00 00 00 00 00 00 00 00
 Timing O_DIRECT disk reads: 762 MB in  3.00 seconds = 253.97 MB/sec

/dev/nvme0n1:
 Timing O_DIRECT cached reads:   4970 MB in  1.99 seconds = 2492.82 MB/sec
 Timing O_DIRECT disk reads: 6850 MB in  3.00 seconds = 2283.01 MB/sec

lspci

Code:
03:00.0 Ethernet controller: Intel Corporation 82599ES 10-Gigabit SFI/SFP+ Network Connection (rev 01)
03:00.1 Ethernet controller: Intel Corporation 82599ES 10-Gigabit SFI/SFP+ Network Connection (rev 01)

When testing, the exchange rate between nodes does not rise above 1-1.5 Gbps

ethtool -g -k -a

Code:
Ring parameters for eno1:

Pre-set maximums:
RX:             512
RX Mini:        n/a
RX Jumbo:       n/a
TX:             512

Current hardware settings:
RX:             512
RX Mini:        n/a
RX Jumbo:       n/a
TX:             512

Pause parameters for eno1:
Autonegotiate:  off
RX:             on
TX:             on

Features for eno1:
rx-checksumming: on
tx-checksumming: on
        tx-checksum-ipv4: off [fixed]
        tx-checksum-ip-generic: on
        tx-checksum-ipv6: off [fixed]
        tx-checksum-fcoe-crc: on [fixed]
        tx-checksum-sctp: on
scatter-gather: on
        tx-scatter-gather: on
        tx-scatter-gather-fraglist: off [fixed]
tcp-segmentation-offload: on
        tx-tcp-segmentation: on
        tx-tcp-ecn-segmentation: off [fixed]
        tx-tcp-mangleid-segmentation: off
        tx-tcp6-segmentation: on
generic-segmentation-offload: on
generic-receive-offload: on
large-receive-offload: off
rx-vlan-offload: on
tx-vlan-offload: on
ntuple-filters: off
receive-hashing: on
highdma: on [fixed]
rx-vlan-filter: on
vlan-challenged: off [fixed]
tx-lockless: off [fixed]
netns-local: off [fixed]
tx-gso-robust: off [fixed]
tx-fcoe-segmentation: on [fixed]
tx-gre-segmentation: on
tx-gre-csum-segmentation: on
tx-ipxip4-segmentation: on
tx-ipxip6-segmentation: on
tx-udp_tnl-segmentation: on
tx-udp_tnl-csum-segmentation: on
tx-gso-partial: on
tx-tunnel-remcsum-segmentation: off [fixed]
tx-sctp-segmentation: off [fixed]
tx-esp-segmentation: on
tx-udp-segmentation: on
tx-gso-list: off [fixed]
fcoe-mtu: off [fixed]
tx-nocache-copy: off
loopback: off [fixed]
rx-fcs: off [fixed]
rx-all: off
tx-vlan-stag-hw-insert: off [fixed]
rx-vlan-stag-hw-parse: off [fixed]
rx-vlan-stag-filter: off [fixed]
l2-fwd-offload: off
hw-tc-offload: off
esp-hw-offload: on
esp-tx-csum-hw-offload: on
rx-udp_tunnel-port-offload: off [fixed]
tls-hw-tx-offload: off [fixed]
tls-hw-rx-offload: off [fixed]
rx-gro-hw: off [fixed]
tls-hw-record: off [fixed]
rx-gro-list: off
macsec-hw-offload: off [fixed]
rx-udp-gro-forwarding: off
hsr-tag-ins-offload: off [fixed]
hsr-tag-rm-offload: off [fixed]
hsr-fwd-offload: off [fixed]
hsr-dup-offload: off [fixed]

What is the optimal testing mechanism? I am using the following commands:

Code:
rbd bench --io-type write --io-size 4096 --io-threads 16 --io-total 1G --io-pattern seq ceph/test_image
bench  type write io_size 4096 io_threads 16 bytes 1073741824 pattern sequential
elapsed: 5   ops: 262144   ops/sec: 46812   bytes/sec: 183 MiB/s

rbd bench --io-type write --io-size 4096 --io-threads 16 --io-total 1G --io-pattern rand ceph/test_image
bench  type write io_size 4096 io_threads 16 bytes 1073741824 pattern random
elapsed: 58   ops: 262144   ops/sec: 4487.9   bytes/sec: 18 MiB/s

rbd bench --io-type read --io-size 4096 --io-threads 16 --io-total 1G --io-pattern seq ceph/test_image
bench  type read io_size 4096 io_threads 16 bytes 1073741824 pattern sequential
elapsed: 36   ops: 262144   ops/sec: 7156.24   bytes/sec: 28 MiB/s

rbd bench --io-type read --io-size 4096 --io-threads 16 --io-total 1G --io-pattern rand ceph/test_image
bench  type read io_size 4096 io_threads 16 bytes 1073741824 pattern random
elapsed: 133   ops: 262144   ops/sec: 1970.44   bytes/sec: 7.7 MiB/s

Maybe I'm testing wrong? Or does it still need to be optimized somehow?
 
Last edited:
You can test your network using iperf3. I believe the bottleneck should be your hard disks. Note that each OSD process can easily consume several GB of memory on the host, so testing of just 1GB might be a test of how fast your nodes can read or write to the memory cache. That's where the test_image size is also important (if it is small it can fit in the memory)...
For the random IO tests, you are limited by IOPS, the SATA disks can do around 80 IOPS, you cannot expect high throughput in that test. If you increase IO size you should expect to see increased throughput (but the IOPS should remain the same)
 
iperf3 results

Code:
root@nd01:~# iperf3 -c nd02
Connecting to host nd02, port 5201
[  5] local 10.50.253.1 port 40590 connected to 10.50.253.2 port 5201
[ ID] Interval           Transfer     Bitrate         Retr  Cwnd
[  5]   0.00-1.00   sec   971 MBytes  8.14 Gbits/sec  328   1.07 MBytes     
[  5]   1.00-2.00   sec   949 MBytes  7.96 Gbits/sec  306    918 KBytes     
[  5]   2.00-3.00   sec   958 MBytes  8.03 Gbits/sec  339   1.36 MBytes     
[  5]   3.00-4.00   sec  1015 MBytes  8.51 Gbits/sec  295    865 KBytes     
[  5]   4.00-5.00   sec   959 MBytes  8.05 Gbits/sec  152   1.08 MBytes     
[  5]   5.00-6.00   sec   929 MBytes  7.79 Gbits/sec   95    961 KBytes     
[  5]   6.00-7.00   sec   946 MBytes  7.94 Gbits/sec  164   1.23 MBytes     
[  5]   7.00-8.00   sec   962 MBytes  8.07 Gbits/sec  143    804 KBytes     
[  5]   8.00-9.00   sec   974 MBytes  8.17 Gbits/sec  366    883 KBytes     
[  5]   9.00-10.00  sec   970 MBytes  8.13 Gbits/sec  321    926 KBytes     
- - - - - - - - - - - - - - - - - - - - - - - - -
[ ID] Interval           Transfer     Bitrate         Retr
[  5]   0.00-10.00  sec  9.41 GBytes  8.08 Gbits/sec  2509             sender
[  5]   0.00-10.04  sec  9.40 GBytes  8.05 Gbits/sec                  receiver

iperf Done.

root@nd01:~# iperf3 -c nd02 --bidir
Connecting to host nd02, port 5201
[  5] local 10.50.253.1 port 40364 connected to 10.50.253.2 port 5201
[  7] local 10.50.253.1 port 40370 connected to 10.50.253.2 port 5201
[ ID][Role] Interval           Transfer     Bitrate         Retr  Cwnd
[  5][TX-C]   0.00-1.00   sec   483 MBytes  4.05 Gbits/sec   48   1.05 MBytes     
[  7][RX-C]   0.00-1.00   sec   773 MBytes  6.49 Gbits/sec               
[  5][TX-C]   1.00-2.00   sec   430 MBytes  3.61 Gbits/sec   96   1.26 MBytes     
[  7][RX-C]   1.00-2.00   sec   822 MBytes  6.89 Gbits/sec               
[  5][TX-C]   2.00-3.00   sec   482 MBytes  4.05 Gbits/sec   25   1.42 MBytes     
[  7][RX-C]   2.00-3.00   sec   782 MBytes  6.56 Gbits/sec               
[  5][TX-C]   3.00-4.00   sec   505 MBytes  4.24 Gbits/sec   96   1.11 MBytes     
[  7][RX-C]   3.00-4.00   sec   737 MBytes  6.18 Gbits/sec               
[  5][TX-C]   4.00-5.00   sec   436 MBytes  3.66 Gbits/sec  100   1.34 MBytes     
[  7][RX-C]   4.00-5.00   sec   814 MBytes  6.83 Gbits/sec               
[  5][TX-C]   5.00-6.00   sec   516 MBytes  4.33 Gbits/sec  135   1.28 MBytes     
[  7][RX-C]   5.00-6.00   sec   708 MBytes  5.94 Gbits/sec               
[  5][TX-C]   6.00-7.00   sec   636 MBytes  5.33 Gbits/sec  100    900 KBytes     
[  7][RX-C]   6.00-7.00   sec   712 MBytes  5.97 Gbits/sec               
[  5][TX-C]   7.00-8.00   sec   501 MBytes  4.21 Gbits/sec   86   1.55 MBytes     
[  7][RX-C]   7.00-8.00   sec   825 MBytes  6.93 Gbits/sec               
[  5][TX-C]   8.00-9.00   sec   511 MBytes  4.29 Gbits/sec   13   1.46 MBytes     
[  7][RX-C]   8.00-9.00   sec   752 MBytes  6.30 Gbits/sec               
[  5][TX-C]   9.00-10.00  sec   542 MBytes  4.55 Gbits/sec  124    874 KBytes     
[  7][RX-C]   9.00-10.00  sec   765 MBytes  6.41 Gbits/sec               
- - - - - - - - - - - - - - - - - - - - - - - - -
[ ID][Role] Interval           Transfer     Bitrate         Retr
[  5][TX-C]   0.00-10.00  sec  4.93 GBytes  4.23 Gbits/sec  823             sender
[  5][TX-C]   0.00-10.04  sec  4.92 GBytes  4.21 Gbits/sec                  receiver
[  7][RX-C]   0.00-10.00  sec  7.51 GBytes  6.45 Gbits/sec  2143             sender
[  7][RX-C]   0.00-10.04  sec  7.51 GBytes  6.42 Gbits/sec                  receiver

iperf Done.

Rbd bench

Code:
rbd create --size 100G ceph/test_image

rbd bench --io-type write --io-size 4096 --io-threads 1 --io-total 50G --io-pattern seq ceph/test_image
bench  type write io_size 4096 io_threads 1 bytes 53687091200 pattern sequential
^C2023-05-31T20:01:05.558+0300 7f233d7fa700 -1 received  signal: Interrupt, si_code : 128, si_value (int): 0, si_value (ptr): 0, si_errno: 0, si_pid : 0, si_uid : 0, si_addr0, si_status0
elapsed: 20   ops: 337818   ops/sec: 16173   bytes/sec: 63 MiB/s

root@nd01:~# rbd bench --io-type write --io-size 4096 --io-threads 1 --io-total 50G --io-pattern rand ceph/test_image
bench  type write io_size 4096 io_threads 1 bytes 53687091200 pattern random
^C2023-05-31T20:01:41.406+0300 7f65077fe700 -1 received  signal: Interrupt, si_code : 128, si_value (int): 0, si_value (ptr): 0, si_errno: 0, si_pid : 0, si_uid : 0, si_addr0, si_status0
elapsed: 22   ops: 14429   ops/sec: 636.319   bytes/sec: 2.5 MiB/s

root@nd01:~# rbd bench --io-type read --io-size 4096 --io-threads 1 --io-total 50G --io-pattern seq ceph/test_image
bench  type read io_size 4096 io_threads 1 bytes 53687091200 pattern sequential
^C2023-05-31T20:02:26.661+0300 7f55627fc700 -1 received  signal: Interrupt, si_code : 128, si_value (int): 0, si_value (ptr): 0, si_errno: 0, si_pid : 0, si_uid : 0, si_addr0, si_status0
elapsed: 21   ops: 22061   ops/sec: 1039.06   bytes/sec: 4.1 MiB/s

root@nd01:~# rbd bench --io-type read --io-size 4096 --io-threads 1 --io-total 50G --io-pattern rand ceph/test_image
bench  type read io_size 4096 io_threads 1 bytes 53687091200 pattern random
^C2023-05-31T20:02:56.741+0300 7ff512ffd700 -1 received  signal: Interrupt, si_code : 128, si_value (int): 0, si_value (ptr): 0, si_errno: 0, si_pid : 0, si_uid : 0, si_addr0, si_status0
elapsed: 21   ops: 33733   ops/sec: 1578.98   bytes/sec: 6.2 MiB/s

storage

Code:
root@nd01:~# lvs -a
  LV                                             VG                                        Attr       LSize    Pool Origin Data%  Meta%  Move Log Cpy%Sync Convert
  osd-db-22849237-33ad-46c6-87c6-bb06eadf370a    ceph-338d1097-d150-4c16-8a85-998c87797c9a -wi-ao----  223,00g                                                   
  osd-db-2c998c73-6c84-4b14-b836-4befa440637c    ceph-338d1097-d150-4c16-8a85-998c87797c9a -wi-ao----  223,00g                                                   
  osd-db-e3d4a1ba-6503-419c-89d1-96ce33824bbb    ceph-338d1097-d150-4c16-8a85-998c87797c9a -wi-ao----  223,00g                                                   
  osd-db-f6db058e-f2c2-45c9-82b6-9c718b133ae9    ceph-338d1097-d150-4c16-8a85-998c87797c9a -wi-ao----  223,00g                                                   
  osd-block-1c6792de-15e4-4b27-a2c2-08fcff03cecc ceph-597f7ea5-da3c-4dd0-9fe9-5f60a44986d9 -wi-ao----   <5,46t                                                   
  osd-block-f64f8925-cfbc-4170-b82b-b73c9ed4f77c ceph-5e58cf53-533a-4e94-b800-28066cf98337 -wi-ao----   <5,46t                                                   
  osd-block-a2b7a9cd-6624-4f93-baf0-ba74834c5719 ceph-6a6c0a0c-ab53-4644-8529-209d10e5609b -wi-ao----   <5,46t                                                   
  osd-block-eaef2689-d3a2-41d8-a6ac-af721cb6eb8e ceph-a8439cfb-fd09-450e-8dda-1e980d40bae2 -wi-ao----   <5,46t                                                   
  root                                           pve                                       -wi-ao---- <214,57g                                                   
  swap                                           pve                                       -wi-ao----    8,00g                                                   
root@nd01:~# vgs -a
  VG                                        #PV #LV #SN Attr   VSize    VFree
  ceph-338d1097-d150-4c16-8a85-998c87797c9a   1   4   0 wz--n-  894,25g 2,25g
  ceph-597f7ea5-da3c-4dd0-9fe9-5f60a44986d9   1   1   0 wz--n-   <5,46t    0
  ceph-5e58cf53-533a-4e94-b800-28066cf98337   1   1   0 wz--n-   <5,46t    0
  ceph-6a6c0a0c-ab53-4644-8529-209d10e5609b   1   1   0 wz--n-   <5,46t    0
  ceph-a8439cfb-fd09-450e-8dda-1e980d40bae2   1   1   0 wz--n-   <5,46t    0
  pve                                         1   2   0 wz--n- <222,57g    0
 
Last edited:
I did some tests and I can't figure out if they are normal or not? Who can explain? During the test, I used --io-size 4096. According to the documentation, data is transferred between nodes with this size.

Below is a link to a Google spreadsheet with the results.

Rbd Bench Results
 
the only thing i see wrong on the config are your harddrives (i guess from your description its spinning disks).
 
a 10gb network can transfer max 1280MB/S.
a ceph network can have 3 bottle necs
1. Network itself (as more as better)
2. Storage itself (SSD, Spindrive, SAN, ...)
3. Logs, database and ceph settings (can be a bit optimized)


as i understand from your output you send//receive data with round about 4-5 gb, which is round about 500mb/s.
google for the fastest hdd:
HDD Speed: Which Is Faster? The fastest HDD to date is the Seagate Exos, which offers 524MB/second speeds. The drive spins at 7,200 revolutions per minute (RPM), which is the fastest a physical object can spin. (maybe not 100% correct)
so it looks to me pretty normal. if you want to optimize, put nvme drive in. my ceph is on nvme storage with 10gb connection and i drive round about 1g transfer per sec.
/dev/sdd:
Timing O_DIRECT cached reads: 860 MB in 2.00 seconds = 429.65 MB/sec
SG_IO: bad/missing sense data, sb[]: 72 05 20 00 00 00 00 1c 02 06 00 00 cf 00 00 00 03 02 00 01 80 0e 00 00 00 00 00 00 00 00 00 00
Timing O_DIRECT disk reads: 762 MB in 3.00 seconds = 253.97 MB/sec

/dev/nvme0n1:
Timing O_DIRECT cached reads: 4970 MB in 1.99 seconds = 2492.82 MB/sec
Timing O_DIRECT disk reads: 6850 MB in 3.00 seconds = 2283.01 MB/sec

here you see the difference in read. write is a complete other subject. dont forget that ceph needs a lot of write performance (it writes simultaneously to all 3 Servers)

there are some settings in ceph for deactivate logging for example which pushes up to 20% more performance, but on your config it should not matter. go an get some enterprise nvme. your customer will enjoy if the VMs runs faster
 
Last edited:
Yes, my drives are HDD type. Below is information about one of them. I understand that the performance on HDD will be an order of magnitude lower than on NVME or SSD, but now there is just such equipment. I want to understand what all the same possible optimal results I can get on this type of disks. Also, if inside the virtual machine I start copying a 5 GB file, then the average write speed is about 80 MB / s, while disk caching is disabled. I want to understand what is the norm and what else can be optimized besides switching to solid state drives.

HDD

Code:
smartctl 7.2 2020-12-30 r5155 [x86_64-linux-5.15.107-2-pve] (local build)
Copyright (C) 2002-20, Bruce Allen, Christian Franke, www.smartmontools.org

=== START OF INFORMATION SECTION ===
Vendor:               SEAGATE
Product:              ST6000NM029A
Revision:             E002
Compliance:           SPC-5
User Capacity:        6 001 175 126 016 bytes [6,00 TB]
Logical block size:   512 bytes
Physical block size:  4096 bytes
LU is fully provisioned
Rotation Rate:        7200 rpm
Form Factor:          3.5 inches
Logical Unit id:      0x5000c500ce462547
Serial number:        WNB0D1FS0000E020ECJZ
Device type:          disk
Transport protocol:   SAS (SPL-3)
Local Time is:        Fri Jun  2 12:11:00 2023 EEST
SMART support is:     Available - device has SMART capability.
SMART support is:     Enabled
Temperature Warning:  Enabled

=== START OF READ SMART DATA SECTION ===
SMART Health Status: OK

Grown defects during certification <not available>
Total blocks reassigned during format <not available>
Total new blocks reassigned <not available>
Power on minutes since format <not available>
Current Drive Temperature:     24 C
Drive Trip Temperature:        60 C

Accumulated power on time, hours:minutes 20030:37
Manufactured in week 25 of year 2020
Specified cycle count over device lifetime:  50000
Accumulated start-stop cycles:  140
Specified load-unload count over device lifetime:  600000
Accumulated load-unload cycles:  969
Elements in grown defect list: 0

Vendor (Seagate Cache) information
  Blocks sent to initiator = 2015930912
  Blocks received from initiator = 1662082208
  Blocks read from cache and sent to initiator = 58234696
  Number of read and write commands whose size <= segment size = 1718686
  Number of read and write commands whose size > segment size = 14412

Vendor (Seagate/Hitachi) factory information
  number of hours powered up = 20030,62
  number of minutes until next internal SMART test = 22

Error counter log:
           Errors Corrected by           Total   Correction     Gigabytes    Total
               ECC          rereads/    errors   algorithm      processed    uncorrected
           fast | delayed   rewrites  corrected  invocations   [10^9 bytes]  errors
read:          0        0         0         0          0       1028,958           0
write:         0        0         0         0          0        851,440           0
verify:        0        0         0         0          0          3,198           0

Non-medium error count:        0


[GLTSD (Global Logging Target Save Disable) set. Enable Save with '-S on']
No Self-tests have been logged

NVME

Code:
smartctl 7.2 2020-12-30 r5155 [x86_64-linux-5.15.107-2-pve] (local build)
Copyright (C) 2002-20, Bruce Allen, Christian Franke, www.smartmontools.org

=== START OF INFORMATION SECTION ===
Model Number:                       SAMSUNG MZ1L2960HCJR-00A07
Serial Number:                      S665NE0T104193
Firmware Version:                   GDC7302Q
PCI Vendor/Subsystem ID:            0x144d
IEEE OUI Identifier:                0x002538
Total NVM Capacity:                 960 197 124 096 [960 GB]
Unallocated NVM Capacity:           0
Controller ID:                      6
NVMe Version:                       1.4
Number of Namespaces:               32
Namespace 1 Size/Capacity:          960 197 124 096 [960 GB]
Namespace 1 Utilization:            835 088 629 760 [835 GB]
Namespace 1 Formatted LBA Size:     512
Local Time is:                      Fri Jun  2 12:17:37 2023 EEST
Firmware Updates (0x17):            3 Slots, Slot 1 R/O, no Reset required
Optional Admin Commands (0x005f):   Security Format Frmw_DL NS_Mngmt Self_Test MI_Snd/Rec
Optional NVM Commands (0x005f):     Comp Wr_Unc DS_Mngmt Wr_Zero Sav/Sel_Feat Timestmp
Log Page Attributes (0x0e):         Cmd_Eff_Lg Ext_Get_Lg Telmtry_Lg
Maximum Data Transfer Size:         512 Pages
Warning  Comp. Temp. Threshold:     77 Celsius
Critical Comp. Temp. Threshold:     85 Celsius
Namespace 1 Features (0x1a):        NA_Fields No_ID_Reuse NP_Fields

Supported Power States
St Op     Max   Active     Idle   RL RT WL WT  Ent_Lat  Ex_Lat
 0 +     8.25W    8.25W       -    0  0  0  0       70      70

Supported LBA Sizes (NSID 0x1)
Id Fmt  Data  Metadt  Rel_Perf
 0 +     512       0         0
 1 -    4096       0         0

=== START OF SMART DATA SECTION ===
SMART overall-health self-assessment test result: PASSED

SMART/Health Information (NVMe Log 0x02)
Critical Warning:                   0x00
Temperature:                        37 Celsius
Available Spare:                    100%
Available Spare Threshold:          10%
Percentage Used:                    0%
Data Units Read:                    2 893 486 [1,48 TB]
Data Units Written:                 3 639 854 [1,86 TB]
Host Read Commands:                 189 430 355
Host Write Commands:                203 598 595
Controller Busy Time:               81
Power Cycles:                       17
Power On Hours:                     1 673
Unsafe Shutdowns:                   7
Media and Data Integrity Errors:    0
Error Information Log Entries:      0
Warning  Comp. Temperature Time:    0
Critical Comp. Temperature Time:    0
Temperature Sensor 1:               37 Celsius
Temperature Sensor 2:               61 Celsius

Error Information (NVMe Log 0x01, 16 of 64 entries)
No Errors Logged

Test virtual machine configuration

Code:
agent: 1
boot: order=sata0;scsi0
cores: 4
cpu: host
machine: pc-q35-7.2
memory: 8192
meta: creation-qemu=7.2.0,ctime=1685091547
name: WINSRV2022
net0: virtio=6A:BE:45:81:F0:63,bridge=vmbr0
numa: 0
ostype: win11
sata0: none,media=cdrom
scsi0: ceph:vm-8888-disk-0,iothread=1,size=80G
scsi1: ceph:vm-8888-disk-1,iothread=1,size=50G
scsi2: ceph:vm-8888-disk-2,iothread=1,size=50G
scsihw: virtio-scsi-single
smbios1: uuid=1cd159dc-b383-42b0-bde8-d8ffab41354d
sockets: 2
vmgenid: f2f8c72c-cabb-4c3a-995c-81fbeda9825e

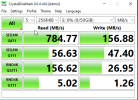
Test results without enabled writeback cache

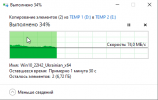
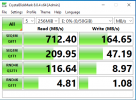
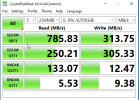
atto_01.pngatto_02.pngcd_1.pngcd_2.png

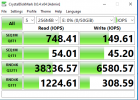
Test results with enabled writeback cache

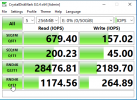
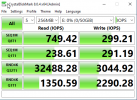
atto_01_cache.pngatto_02_cache.pngcd_1_cache.pngcd_2_cache.png

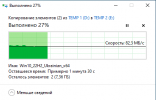
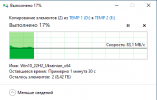
Copy 10 Gb in VM from vhd to vhd

copy_1.png

Can such results be considered hearty, good or bad? Why, at the time of write load, in fact, the network is loaded only up to 1.5 Gb/s, which is equivalent to the speed of working with one hard drive or even less. Doesn't ceph work simultaneously with all disks, in my case 4 pcs. summing up their performance? That is, if the speed for writing to 1 disk is approximately 200 Mb/s, then 4 disks should give out 800 Mb/s. When converted to network load, we get: 6.4 Gb/s. Maybe I think something is wrong?
 
use virtio harddrive and not scsi
virtio is much more performanter. please publish the results
 
I changed the virtual machine settings. Also that in the first and second tests, the io-thread option is enabled, which is offered by default

Code:
agent: 1
boot: order=sata0;virtio0
cores: 4
cpu: host
machine: pc-q35-7.2
memory: 8192
meta: creation-qemu=7.2.0,ctime=1685091547
name: WINSRV2022
net0: virtio=6A:BE:45:81:F0:63,bridge=vmbr0
numa: 0
ostype: win11
sata0: none,media=cdrom
scsihw: virtio-scsi-single
smbios1: uuid=1cd159dc-b383-42b0-bde8-d8ffab41354d
sockets: 2
virtio0: ceph:vm-8888-disk-0,iothread=1,size=80G
virtio1: ceph:vm-8888-disk-1,iothread=1,size=50G
virtio2: ceph:vm-8888-disk-2,iothread=1,size=50G
vmgenid: f2f8c72c-cabb-4c3a-995c-81fbeda9825e


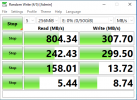
Test results without enabled writeback cache

atto_03_virtioblk.pngatto_04_virtioblk.pngcd_3_virtioblk.pngcd_4_virtioblk.png

Copy 10 Gb in VM from vhd to vhd

copy_2_virtioblk.png

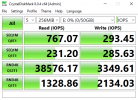
Test results with enabled writeback cache


atto_05_virtioblk_cache.pngatto_06_virtioblk_cache.pngcd_3_virtioblk_cache.pngcd_4_virtioblk_cache.png

Copy 10 Gb in VM from vhd to vhd

copy_2_virtioblk_cache.png
 
Last edited:
Please don't forget that those 250MB/s throughput on HDDs are only for the large sequential operations. You can expect it to drop to 2.5MB/s or lower for random IOPS... Actually with truly random IO you should get only around 320KB/s throughput per disk (SATA drives doing 80 IOPS times 4K).

I don't think there is any magical tuning that would make HDD-based pools faster, or it would have been embedded into ceph already...
 
  • Like
Reactions: pille99
Please don't forget that those 250MB/s throughput on HDDs are only for the large sequential operations. You can expect it to drop to 2.5MB/s or lower for random IOPS... Actually with truly random IO you should get only around 320KB/s throughput per disk (SATA drives doing 80 IOPS times 4K).

I don't think there is any magical tuning that would make HDD-based pools faster, or it would have been embedded into ceph already...
agreed, and even he/she can squeeze some bits transfer-rate out of the configurations, he/she forget as more VMs they have on the storage as lower the transferrate gets. in other words - i would say more as 3 VMs per Drive the performance goes so much down that your users will start to complain.
from the config details i supose its a business network. get some budget and buy nvme or as least ssd drives. you, your boss and your users will thank you.
take the drives in a seperate server and use it for a backup solution
 
Last edited:
The scenario is quite simple - using your internal services with fault tolerance.
Still, I don't understand one thing. When I used nvme to run a data pool on it, the network exchange rate also did not exceed 1.5 Gbit/s as well as with conventional HDDs. Why?
 
This is one of the reasons why I went with ZFS with replication instead of CEPH when I rebuilt the ProxMox clusters. Much as I love CEPH's fault tolerance and able to self heal on it's own without any involvement from me the performance with regular spinning 8TB 7.2K SAS HDDs just wasn't there. Even on multi 10 gig networks.

Every time I either do something like deleting the snapshots or rebooting the node the VMs themselves on the entire cluster suffer performance issues.

Only way this makes sense if my entire storage system are SSDs or nvme which are expensive for server class equipment. Granted, they are coming down in price but still expensive when I need large amount of storage space to support the VMs.

CEPH did have tier'd storage where HHDs are the secondary while the SSDs/nvme are primary. This was recently depreciated due to complexity issues and is not recommended.
 
Last edited:
In general, SSDs will provide more IOPS than spinning disks. With this in mind,in addition to the higher cost, it may make sense to implement aclass based separation of pools

its just for segregation. example:
drive a nvme - mark as X
drive B hdd - mark as y
(instead of all marked as z)
now you can segragate more like all high demand workload will be done on x
and storage funktion will be done on y

it may makes it faster because the workload is done on the more appropriate "osd"
 

About

The Proxmox community has been around for many years and offers help and support for Proxmox VE, Proxmox Backup Server, and Proxmox Mail Gateway.
We think our community is one of the best thanks to people like you!

Get your subscription!

The Proxmox team works very hard to make sure you are running the best software and getting stable updates and security enhancements, as well as quick enterprise support. Tens of thousands of happy customers have a Proxmox subscription. Get yours easily in our online shop.

Buy now!