Monitoring with Zabbix Not Working

flavio.bk

Member
Jul 19, 2022
5
3
8
I am trying to use Zabbix to monitor Proxmox
Template Proxmox VE by HTTP (https://git.zabbix.com/projects/ZBX...mplates/app/proxmox?at=refs/heads/release/6.0)

Zabbix 6.0
PVE 6.4-4

-- API TOKEN configured
-- Uncheck Privilege Separation option


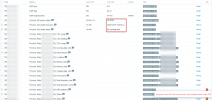
The Last Results are:

Proxmox: API service status1h 44m 38sOK (200)
Proxmox: Get cluster resources42s{"data":[{"id":"node/node01","type":"node","level":"","node":"node01","status":"online"}]}
Proxmox: Get cluster status1m 13sError getting data

What can I do to solve this problem ?
 

Attachments

  • img-forum-proxmox.png
    img-forum-proxmox.png
    174.3 KB · Views: 602
  • Like
Reactions: pablopol24
hi,

when you check the URL https://{HOST.CONN}:{$PVE.URL.PORT}/api2/json/cluster/status manually does it respond with the correct status information for the cluster?

you can try doing a curl (with the cookie and CSRF token attached, or using the API token) and post the response here
 
hi,

when you check the URL https://{HOST.CONN}:{$PVE.URL.PORT}/api2/json/cluster/status manually does it respond with the correct status information for the cluster?

you can try doing a curl (with the cookie and CSRF token attached, or using the API token) and post the response here
Hi oguz,
I followed your suggest.
With Cookies, passed ok. With ApiToken I had problem using curl because the exclamation point: !
suggest.png


At sametime, I created a new TokenAPI/SecretToken and now I received all itens:) however with no data:(
I am waiting if something happens:
no-data.png
 
Last edited:
Update:
Problem Solved
The data have been received.

The problem was the api token/secret.
 
Last edited:
  • Like
Reactions: oguz
for me the {HOST.CONN} don't bring any value, do you have some idea where could be the error?, if I write manually the ip or hostname, I can run the test successfully.


JHDFkToUPv.png
 
For me it works neither with checked nor unchecked priviledge separation, unfortunatly.

What does priv sep do and how can i debug my zabbix access?
 
same problem here always Unknown Error (520) there is no post to explain how tshoot this issue
 
After quite a bit of googling I found that a timeout can result in 520 codes.

As soon as I added a firewall rule allowing the zabbix server to talk to the proxmox host on tcp/8006 it sprung to life. Still confusing the hell out of me tho as the template is applied to the proxmox host and not the zabbix server. Not sure why the check isn't done by the agent on the proxmox host.
 
I was getting the 520 error after changing my connection to go through a reverse proxy. I'm now connecting to proxmox.domain.com:443 instead of proxmox1.xxx.domain.com:8006, proxmox2.xxx.domain.com:8006, etc. Load balancing :)

So in the Host config in Zabbix, Host tab, I updated the Interfaces entry (type happens to be Agent but this doesn't matter) with the new DNS name and changed the port there from 8006 to 443. Now I was getting 520 errors and nothing in the reverse proxy logs. Very frustrating.

Eventually I saw in the Zabbix server logs that it was still trying to connect on 8006. So I check the Macros tab and there is a default of 8006 specified there. The port in the Interfaces line does nothing, even though the DNS (or IP, if you use that) does have an effect. So I updated {$PVE.URL.PORT} from 8006 to 443 and everything started working.