[SOLVED] Monitoring Proxmox cluster with infludb

Philb

New Member
Jun 5, 2025
3
0
1
I have setup a 3 node cluster on version 8.4.1 as I am currently testing Promox and have just sent up sending metrics to influxdb v2 using a metrics server. I am having an issue were Promox seems to be only sending metrics of 1 host PVE01, There is no data in the infludb for the other 2 hosts PVE02 and PVE03. Has anyone ever come across this while monitoring a cluster with influxdb? Any help would be apprecited.
 
There is no data in the infludb for the other 2 hosts PVE02 and PVE03
I don't use influxDB but I once looked at it. When you say you can't see the data of the other nodes in influxDB; are you sure you really mean in influxDB or maybe you actually mean in Grafana? Within Grafana (if I remember correctly) you need to select the Server dropdown menu to select which node/s are being shown.

If you actually mean you cannot see the other nodes within influxDB then please provide the details of how you set it up - so that someone can help you.
 
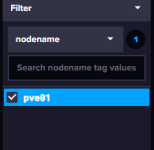
Thanks for the reply. Yes, I mean in influxDB it only shows the first host. Below should have 01 to 03
1749108833275.png

The setup is fairly simple.
Create a bucket in influx.
Create an api and write permissions to the bucket.
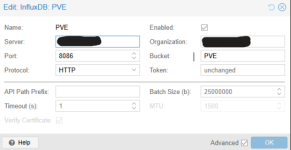
In proxmox setup metric server under cluster to the influx ip. I changed it to http using port 8086 and an api token.
1749109003946.png
 
As I said above, I don't use any of the above. But maybe something I'd try in your situation:

Try using a different bucket name in influxDB than the defined named metric server in Proxmox (you've used PVE in both).
AFAIK the default bucket name that Proxmox uses for the influxDB is proxmox . I think that certain dashboards are built around that. So in your case I'd leave the named metric server in Proxmox as PVE but use the default bucket name proxmox in influxDB.
Strange, I just deleted the metric server from Promox and set it back up with the same settings and now all 3 are showing in Influxdb, thanks. I ran the latest updates, removed the metric server in Promox and rebooted. Once set back up all 3 hosts showed
 
Last edited: