Memory problem

PaulVM

Renowned Member
May 24, 2011
102
3
83
I have this small box that I use as firewall for my office/lab test.
There are only 2 little VM running (both pfsense box with 1 GB RAM, minimal network traffic):
Code:
# qm list
      VMID NAME                 STATUS     MEM(MB)    BOOTDISK(GB) PID
     21971 pfSenseF1            running    1024               0.00 27845
    142301 pfSenseFW            running    1024               0.00 1963

Seems that every few days the system kills one of my VM because it has exausted memory.
I am searching a reason of this and how to solve.
This started after I updated the box adding RAM (from 8 to 16 GB), and updated the PVE installation. No problem before (installed from 6 month).

Screenshot_2020-04-11_Gen_MonthAVG.png
Screenshot_2020-04-11_Load-RAM_MonthAVG.png
Screenshot_2020-04-11_Load-RAM_DayAVG.png
Yesterday at 19.15 OOM Kill of the VM. Manually restarted 1 hour later.
This morning no know activity.
Screenshot_2020-04-11_RAM_7_00.png
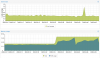
Specificaly interested in what can have increased the used RAM from 3.4 GB to 9.3 GB between 6.00 and 7.00 this morning.
No new VM, no backup or scheduled activities ...

I use ZFS for RAID-1 install (only 1 TB of disks):

Code:
# zfs list
NAME               USED  AVAIL     REFER  MOUNTPOINT
rpool              331G   537G       96K  /rpool
rpool/ROOT         331G   537G       96K  /rpool/ROOT
rpool/ROOT/pve-1   331G   537G      331G  /
rpool/data          96K   537G       96K  /rpool/data

# zpool status
  pool: rpool
state: ONLINE
  scan: scrub repaired 0B in 0 days 00:28:51 with 0 errors on Sun Mar  8 00:52:53 2020
config:

        NAME                                           STATE     READ WRITE CKSUM
        rpool                                          ONLINE       0     0     0
          mirror-0                                     ONLINE       0     0     0
            ata-WDC_WD8003FFBX-68B9AN0_VAGLJEBL-part3  ONLINE       0     0     0
            ata-WDC_WD8003FFBX-68B9AN0_VAGLGA9L-part3  ONLINE       0     0     0

errors: No known data errors

Thanks, P.
 

Attachments

  • Screenshot_2020-04-11_Load-RAM_MonthAVG.png
    Screenshot_2020-04-11_Load-RAM_MonthAVG.png
    43.4 KB · Views: 0
first zfs can use up to half of your memory (on a default setup) but it seems in your case something is even using more memory..
you could check 'top' (or similar) to see which program uses the memory...
 
I tried to understand the situatiion using "top" & c., but I can't find a logical answer (for me).
Top always give something like:
Code:
top - 22:26:52 up 20 days, 21:38,  7 users,  load average: 0.79, 0.75, 1.02
Tasks: 257 total,   1 running, 255 sleeping,   0 stopped,   1 zombie
%Cpu(s):  0.6 us,  0.8 sy,  0.0 ni, 89.6 id,  8.1 wa,  0.0 hi,  0.8 si,  0.0 st
MiB Mem :  15845.5 total,   3493.7 free,   2656.2 used,   9695.6 buff/cache
MiB Swap:   2048.0 total,   1076.7 free,    971.2 used.  12706.1 avail Mem

  PID USER      PR  NI    VIRT    RES    SHR S  %CPU  %MEM     TIME+ COMMAND
27845 root      20   0 1633232 871292   4768 S   6.7   5.4 569:00.19 kvm
 1963 root      20   0 1713096 548560   3668 S   6.3   3.4   1757:17 kvm
22908 root      20   0  450200  22416    500 S   0.7   0.1  22:04.26 sshfs
 1128 www-data  20   0  356564  42680  10052 S   0.3   0.3   0:01.28 pveproxy worker
22737 root      20   0   16068   5712   4640 S   0.3   0.0  67:24.87 ssh
    1 root      20   0  170132   4984   2788 S   0.0   0.0   1:12.40 systemd

Where I see the 2 VM are using less than a couple of GB as expected (they have 1 GB and are doing near nothing). While the PVE graph reports more than 9 GB used.
To complicate my understanding of the situation I have its evolution. I didn't nothing. Only started a huge rsync (about 1.5 TB) with a remote server mounted via sshfs.
I expected a worse situation and instead this is what I had:
Screenshot_2020-04-15_Gen_WeekAVG.png
Screenshot_2020-04-15_MEM-Net.png

Network traffic increase, CPU Usage increased, Serverload increased. as expected, but Memory usage drastically decreased !!!
Can someone give me some hints to understad this behavior ?
I started this investigation because I had 2 unjustified ooKill.

Thanks, P.
 
mhmm the 'top' output is not that helpful because it seems it is from the current state with not much memory usage? (at least the numbers nearly align)
a 'top' during high memory usage would be good... (also the logs/dmesg could be helpful)
 

About

The Proxmox community has been around for many years and offers help and support for Proxmox VE, Proxmox Backup Server, and Proxmox Mail Gateway.
We think our community is one of the best thanks to people like you!

Get your subscription!

The Proxmox team works very hard to make sure you are running the best software and getting stable updates and security enhancements, as well as quick enterprise support. Tens of thousands of happy customers have a Proxmox subscription. Get yours easily in our online shop.

Buy now!