Load Average increasing

vtmikel

New Member
Jul 21, 2022
5
0
1
Hi-

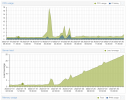
I know that this is not per-se a proxmox question. I'm seeing a strange pattern with the reported load average of my server. I don't have my resources over committed, and you can see that the increase in load average does not correspond to my CPU usage. When I leave this at this increasing rate, I've seen load average exceed 250, but the server is running fine.

Nothing abnormal with reviewing output of dmesg -T. When I reboot, the problem goes away for a few days, then reappears. I tried shutting down my VM's and LXC's one-by-one and seeing if the load average starts to bend downward, no luck. Only a full reboot fixes.

I keep everything up to date, so I'm running the latest packages (no subscription).

Anyone have any suggestions on where to look?
1658358390049.png
 
I do not see anything out of the ordinary. My most resource intensive VM is the top user of CPU time, but it matches the CPU usage chart I shared. I have 16 cores and they are hardly being utilized.

Odd question - is there any chance the calculation for the server load is incorrect or erroneous? That’s how it feels to me, as the load times I’m seeing does not correspond with the performance.
 
What is the output of uptime?

Any other processes? Maybe post the output of ps auxwf? It is probably best if you redirect the output to a file and upload that.
 
Odd question - is there any chance the calculation for the server load is incorrect or erroneous? That’s how it feels to me, as the load times I’m seeing does not correspond with the performance.

The GUI should just show the same numbers that you get through 'top', 'uptime' or similar (you gotta check that first).

On the topic of Load Averages, a few days ago someone posted a similar question and mira replied with an lik to an interesting read:
https://forum.proxmox.com/threads/demystifying-load-averages.112303/#post-485014

The 'Load average' number also counts tasks that are in the TASK_UNINTERRUPTIBLE state, which usually happens when they are waiting for I/O. So the number is more a 'System load average' than a 'CPU load average'. Also you might be able to analyze the output of your top command:
You may have seen this state before: it shows up as the "D" state in the output ps and top. The ps(1) man page calls it "uninterruptible sleep (usually IO)".
 
Here is the output:

Bash:
root@pve:~# uptime
 23:16:57 up 9 days, 41 min,  1 user,  load average: 56.12, 56.75, 57.16

As you can see, load average has doubled since yesterday.

processes output is attached. Any thought on the number of cifs processes running?
 

Attachments

  • processes.txt
    123.5 KB · Views: 15
Last edited:
Any thought on the number of cifs processes running?
Yeah, questions. ;) What is this? Is there some additional packages for that installed on the node itself, or are there some containers where it is running in?

Quite a lot of them are in D state, waiting for IO to finish. Are they stuck in that state?
 
Quite a lot of them are in D state, waiting for IO to finish. Are they stuck in that state?
That will increase the load average, but it will not increase the cpu utilization. I worked in the past on system with other 100 load, that were very snappy with also a lot of processes in D state. Why are there so many cifsd processes? That looks strange to me. What do you do on the system with cifs?
 
No added packages on my node except a package for my old UPS.

CIFS mount is used for the Proxmox backup storage location. Additionally a few of my containers use a SMB/CIFS mount within. I changed my NAS from a Synology to a Unraid server (physical), and the timing corresponds to when I saw this problem emerge. I also used that upgrade to switch from NFS to SMB.

Any idea why the processes would behave like that? The NAS Server is up and running fine with no interruptions.
 
Here you go:

Code:
root@pve:~# cat /proc/mounts
sysfs /sys sysfs rw,nosuid,nodev,noexec,relatime 0 0
proc /proc proc rw,relatime 0 0
udev /dev devtmpfs rw,nosuid,relatime,size=32816232k,nr_inodes=8204058,mode=755,inode64 0 0
devpts /dev/pts devpts rw,nosuid,noexec,relatime,gid=5,mode=620,ptmxmode=000 0 0
tmpfs /run tmpfs rw,nosuid,nodev,noexec,relatime,size=6570084k,mode=755,inode64 0 0
rpool/ROOT/pve-1 / zfs rw,relatime,xattr,noacl 0 0
securityfs /sys/kernel/security securityfs rw,nosuid,nodev,noexec,relatime 0 0
tmpfs /dev/shm tmpfs rw,nosuid,nodev,inode64 0 0
tmpfs /run/lock tmpfs rw,nosuid,nodev,noexec,relatime,size=5120k,inode64 0 0
cgroup2 /sys/fs/cgroup cgroup2 rw,nosuid,nodev,noexec,relatime 0 0
pstore /sys/fs/pstore pstore rw,nosuid,nodev,noexec,relatime 0 0
efivarfs /sys/firmware/efi/efivars efivarfs rw,nosuid,nodev,noexec,relatime 0 0
bpf /sys/fs/bpf bpf rw,nosuid,nodev,noexec,relatime,mode=700 0 0
systemd-1 /proc/sys/fs/binfmt_misc autofs rw,relatime,fd=30,pgrp=1,timeout=0,minproto=5,maxproto=5,direct,pipe_ino=62727 0 0
hugetlbfs /dev/hugepages hugetlbfs rw,relatime,pagesize=2M 0 0
mqueue /dev/mqueue mqueue rw,nosuid,nodev,noexec,relatime 0 0
debugfs /sys/kernel/debug debugfs rw,nosuid,nodev,noexec,relatime 0 0
tracefs /sys/kernel/tracing tracefs rw,nosuid,nodev,noexec,relatime 0 0
sunrpc /run/rpc_pipefs rpc_pipefs rw,relatime 0 0
fusectl /sys/fs/fuse/connections fusectl rw,nosuid,nodev,noexec,relatime 0 0
configfs /sys/kernel/config configfs rw,nosuid,nodev,noexec,relatime 0 0
rpool /rpool zfs rw,noatime,xattr,noacl 0 0
rpool/ROOT /rpool/ROOT zfs rw,noatime,xattr,noacl 0 0
rpool/data /rpool/data zfs rw,noatime,xattr,noacl 0 0
rpool/data/subvol-106-disk-0 /rpool/data/subvol-106-disk-0 zfs rw,noatime,xattr,posixacl 0 0
rpool/data/subvol-102-disk-0 /rpool/data/subvol-102-disk-0 zfs rw,noatime,xattr,posixacl 0 0
rpool/data/subvol-100-disk-0 /rpool/data/subvol-100-disk-0 zfs rw,noatime,xattr,posixacl 0 0
data /data zfs rw,xattr,noacl 0 0
data/subvol-109-disk-0 /data/subvol-109-disk-0 zfs rw,xattr,posixacl 0 0
data/subvol-109-disk-2 /data/subvol-109-disk-2 zfs rw,xattr,posixacl 0 0
data/subvol-109-disk-1 /data/subvol-109-disk-1 zfs rw,xattr,posixacl 0 0
lxcfs /var/lib/lxcfs fuse.lxcfs rw,nosuid,nodev,relatime,user_id=0,group_id=0,allow_other 0 0
//10.66.3.42/backups /mnt/pve/Unraid_Backup cifs rw,relatime,vers=3.1.1,cache=strict,username=XXXX,uid=0,noforceuid,gid=0,noforcegid,addr=10.66.3.42,file_mode=0755,dir_mode=0755,soft,nounix,serverino,mapposix,rsize=4194304,wsize=4194304,bsize=1048576,echo_interval=60,actimeo=1 0 0
/dev/fuse /etc/pve fuse rw,nosuid,nodev,relatime,user_id=0,group_id=0,default_permissions,allow_other 0 0
tmpfs /run/user/0 tmpfs rw,nosuid,nodev,relatime,size=6570080k,nr_inodes=1642520,mode=700,inode64 0 0
 
Okay, that output is not as big as I would have hoped.

Can you try to umount the cifs and remount if needed? I still think that there is something wrong with the amount of kernel threads cifsd. Can you also correlate a high load average with a huge number of cifsd kernel processes? Are they both increasing?
 

About

The Proxmox community has been around for many years and offers help and support for Proxmox VE, Proxmox Backup Server, and Proxmox Mail Gateway.
We think our community is one of the best thanks to people like you!

Get your subscription!

The Proxmox team works very hard to make sure you are running the best software and getting stable updates and security enhancements, as well as quick enterprise support. Tens of thousands of happy customers have a Proxmox subscription. Get yours easily in our online shop.

Buy now!