Hi All,
I am hoping to get some insight into why my cluster load averages are fairly high despite low CPU Loads & I/O Wait.
Basic Overview: 3x Dell R740xD; Dual Xeon Gold 6138 (2x 20/40 = 80c), 10x32GB 2666MHz DDR4
Storage Type: Ceph (hyper converged)
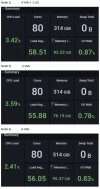
Here's a snapshot from my Grafana dashboard (time interval is 60s). This represents a typical load. Lately, a 'high load' would be ~4-5% CPU & ~2-3% I/O Wait.

I understand the basic concept of Load Averages - it being a ratio against total system cores. But it seems that I'm rapidly approaching the 80 average ceiling that I don't want to surpass while still have a ton of system resources available.
I have taken a dive into htop and I only have a couple VMs that are real heavy-hitters in terms of # processes & utilization.
Are there other factors to take into account? How can I better interpret these numbers? Or are load averages simply a defunct metric that I shouldn't worry too much about? I've read both sides of the argument, but am still not sure how to interpret/diagnose/improve based on these numbers.
Any help would be much appreciated. I'm happy to supply more info if needed. Thanks
I am hoping to get some insight into why my cluster load averages are fairly high despite low CPU Loads & I/O Wait.
Basic Overview: 3x Dell R740xD; Dual Xeon Gold 6138 (2x 20/40 = 80c), 10x32GB 2666MHz DDR4
Storage Type: Ceph (hyper converged)
Here's a snapshot from my Grafana dashboard (time interval is 60s). This represents a typical load. Lately, a 'high load' would be ~4-5% CPU & ~2-3% I/O Wait.

I understand the basic concept of Load Averages - it being a ratio against total system cores. But it seems that I'm rapidly approaching the 80 average ceiling that I don't want to surpass while still have a ton of system resources available.
I have taken a dive into htop and I only have a couple VMs that are real heavy-hitters in terms of # processes & utilization.
Are there other factors to take into account? How can I better interpret these numbers? Or are load averages simply a defunct metric that I shouldn't worry too much about? I've read both sides of the argument, but am still not sure how to interpret/diagnose/improve based on these numbers.
Any help would be much appreciated. I'm happy to supply more info if needed. Thanks
Last edited:

