Issue on ram usage
- Thread starter maxencefiu
- Start date
You are using an out of date browser. It may not display this or other websites correctly.
You should upgrade or use an alternative browser.
You should upgrade or use an alternative browser.
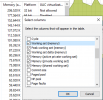
Windows Taskmanager has a "Details-Tab" where you can show more fields about memory.
The Process-List does not really show all memory a Process has allocated....
What do these "Command Processors" do? Running an application or something?
Consider an AV-Scan....
The Process-List does not really show all memory a Process has allocated....
What do these "Command Processors" do? Running an application or something?
Consider an AV-Scan....
Even in the detailed version it uses no more than 8 gb, there are no viruses. It seems to be a misconfiguration I did on proxmox or I don't know.Windows Taskmanager has a "Details-Tab" where you can show more fields about memory.
The Process-List does not really show all memory a Process has allocated....
What do these "Command Processors" do? Running an application or something?
Consider an AV-Scan....
I reinstalled virtio manually with the exe. It cleared the ram but not the CPU.Balooning enabled in PVE?
virtio-drivers installed?
Yes balooning enabled.
Disable balooning, set processor to HOST....I reinstalled virtio manually with the exe. It cleared the ram but not the CPU.
Yes balooning enabled.
PVE-Version?
ram usage on proxmox dashboard is VM ram usage + linux disk cache + arc cache (if zfs being used)
so this gauge is not perfect for getting an overview on real ressource usage
so this gauge is not perfect for getting an overview on real ressource usage
Ok I managed to patch apparently following your help, however the VM ram goes up without me doing anything on it. It goes up until it reaches its maximum. The version is : 7.4-13Disable balooning, set processor to HOST....
PVE-Version?

I guess he is talking about 97% Usage shown in Taskmgr in his Srv22 Guest....ram usage on proxmox dashboard is VM ram usage + linux disk cache + arc cache (if zfs being used)
so this gauge is not perfect for getting an overview on real ressource usage
Dashboard looks normal to me... but why is the Guest at 97%? What workload is running inside VM?
I've talked to people who know more about it than I do, and they tell me it's a bug that's not currently patching balooning on Windows. This sometimes happens on randoms VMs, or even all of them, and there's nothing we can do about it.I guess he is talking about 97% Usage shown in Taskmgr in his Srv22 Guest....
Dashboard looks normal to me... but why is the Guest at 97%? What workload is running inside VM?
so, if more then one person tell this is a balloning bug - what's the bug id / link for this ?


