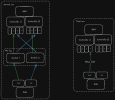
I'm having some issues with iSCSI. My setup consists of the following:

I'm able to successfully setup iSCSI, i can see the sessions listed and see the disks when running
I will get
When i boot into a live fedora iso and setup iSCSI, i dont have this issue so it seems to be pve related. To narrow down the issue i have disabled MPIO as it makes the trouble shooting harder.
I have tried the following but it did not fix the issue:
I have changed the following options in the iscsiconfig
When im not actively putting load on the connection, the sessions seem to be running fine
These are the options on the nic, both are the same
This is my
The load test returns the following
When running the load test the following shows up in journalctl
This is what dmesg shows
Hopefully anyone can be of help, i'm loosing my mind over this.
- Dell ME4024
10Gb iSCSI on controller A and B
jubmo frames enabled - FortiSwitch 4048F (MCLAG)
Flow control enabled with jumbo frames. - PowerEdge R640 (Started with mellanox nic, moved to Intel nic)
CPU(s) 32 x Intel(R) Xeon(R) Gold 6134 CPU @ 3.20GHz (2 Sockets)
Kernel Version Linux 6.8.12-8-pve (2025-01-24T12:32Z)
Boot Mode EFI
Manager Version pve-manager/8.3.5/dac3aa88bac3f300
Intel(R) Ethernet 25G 2P E810-XXV Adapter (jumbo frames enabled)
Green VLAN 3000 and Blue VLAN 3002

I'm able to successfully setup iSCSI, i can see the sessions listed and see the disks when running
lsblk. The problem starts when load is put on the connection with VM's or with fio.I will get
ISCSI_ERR_TCP_CONN_CLOSE errors and detected conn error (1020) . When this happens there is no IO going over the iSCSI connection and it does not matter if i'm using MPIO or not. I dont see any logs related to connections on the DELL ME4.When i boot into a live fedora iso and setup iSCSI, i dont have this issue so it seems to be pve related. To narrow down the issue i have disabled MPIO as it makes the trouble shooting harder.
I have tried the following but it did not fix the issue:
- use a direct network link from PVE to the ME4 with a dell DAC(see diagram)
- reinstall pve
- disable TSO, GSO and GRO on the nic's
- switch from mellanox to intel nic's
- try iSCSI with a live fedora iso(iscsi worked fine)
- try a different node
I have changed the following options in the iscsiconfig
Code:
node.session.timeo.replacement_timeout = 15 # dell recommands 5 but it had no diff
#dell recommanded options
node.session.cmds_max = 1024
node.session.queue_depth = 128
When im not actively putting load on the connection, the sessions seem to be running fine
Code:
root@afs-pve02:~# iscsiadm -m session
tcp: [1] 172.16.22.52:3260,6 iqn.1988-11.com.dell:01.array.bc305bf1c935 (non-flash)
tcp: [2] 172.16.20.51:3260,4 iqn.1988-11.com.dell:01.array.bc305bf1c935 (non-flash)
tcp: [3] 172.16.20.41:3260,3 iqn.1988-11.com.dell:01.array.bc305bf1c935 (non-flash)
tcp: [4] 172.16.22.42:3260,5 iqn.1988-11.com.dell:01.array.bc305bf1c935 (non-flash)


root@afs-pve02:~# iscsiadm -m session -P 3
iSCSI Transport Class version 2.0-870
version 2.1.8
Target: iqn.1988-11.com.dell:01.array.bc305bf1c935 (non-flash)
        Current Portal: 172.16.22.52:3260,6
        Persistent Portal: 172.16.22.52:3260,6
                **********
                Interface:
                **********
                Iface Name: default
                Iface Transport: tcp
                Iface Initiatorname: iqn.1993-08.org.debian:01:6bd4d68bef7
                Iface IPaddress: 172.16.22.22
                Iface HWaddress: default
                Iface Netdev: default
                SID: 1
                iSCSI Connection State: LOGGED IN
                iSCSI Session State: LOGGED_IN
                Internal iscsid Session State: NO CHANGE
                *********
                Timeouts:
                *********
                Recovery Timeout: 15
                Target Reset Timeout: 30
                LUN Reset Timeout: 30
                Abort Timeout: 15
                *****
                CHAP:
                *****
                username: <empty>
                password: ********
                username_in: <empty>
                password_in: ********
                ************************
                Negotiated iSCSI params:
                ************************
                HeaderDigest: None
                DataDigest: None
                MaxRecvDataSegmentLength: 262144
                MaxXmitDataSegmentLength: 262144
                FirstBurstLength: 262144
                MaxBurstLength: 2097152
                ImmediateData: No
                InitialR2T: Yes
                MaxOutstandingR2T: 1
                ************************
                Attached SCSI devices:
                ************************
                Host Number: 19 State: running
                scsi19 Channel 00 Id 0 Lun: 0
                        Attached scsi disk sdd          State: running
These are the options on the nic, both are the same
Code:
root@afs-pve02:~# ethtool -k ens3f1np1
Features for ens3f1np1:
rx-checksumming: on
tx-checksumming: on
        tx-checksum-ipv4: on
        tx-checksum-ip-generic: off [fixed]
        tx-checksum-ipv6: on
        tx-checksum-fcoe-crc: off [fixed]
        tx-checksum-sctp: on
scatter-gather: on
        tx-scatter-gather: on
        tx-scatter-gather-fraglist: off [fixed]
tcp-segmentation-offload: off
        tx-tcp-segmentation: off
        tx-tcp-ecn-segmentation: off
        tx-tcp-mangleid-segmentation: off
        tx-tcp6-segmentation: off
generic-segmentation-offload: off
generic-receive-offload: off
large-receive-offload: off [fixed]
rx-vlan-offload: on
tx-vlan-offload: on
ntuple-filters: on
receive-hashing: on
highdma: on
rx-vlan-filter: on
vlan-challenged: off [fixed]
tx-lockless: off [fixed]
netns-local: off [fixed]
tx-gso-robust: off [fixed]
tx-fcoe-segmentation: off [fixed]
tx-gre-segmentation: on
tx-gre-csum-segmentation: on
tx-ipxip4-segmentation: on
tx-ipxip6-segmentation: on
tx-udp_tnl-segmentation: on
tx-udp_tnl-csum-segmentation: on
tx-gso-partial: on
tx-tunnel-remcsum-segmentation: off [fixed]
tx-sctp-segmentation: off [fixed]
tx-esp-segmentation: off [fixed]
tx-udp-segmentation: on
tx-gso-list: off [fixed]
fcoe-mtu: off [fixed]
tx-nocache-copy: off
loopback: off
rx-fcs: off
rx-all: off [fixed]
tx-vlan-stag-hw-insert: off
rx-vlan-stag-hw-parse: off
rx-vlan-stag-filter: on
l2-fwd-offload: off [fixed]
hw-tc-offload: off
esp-hw-offload: off [fixed]
esp-tx-csum-hw-offload: off [fixed]
rx-udp_tunnel-port-offload: on
tls-hw-tx-offload: off [fixed]
tls-hw-rx-offload: off [fixed]
rx-gro-hw: off [fixed]
tls-hw-record: off [fixed]
rx-gro-list: off
macsec-hw-offload: off [fixed]
rx-udp-gro-forwarding: off
hsr-tag-ins-offload: off [fixed]
hsr-tag-rm-offload: off [fixed]
hsr-fwd-offload: off [fixed]
hsr-dup-offload: off [fixed]


root@afs-pve02:~# ethtool -a ens3f1np1
Pause parameters for ens3f1np1:
Autonegotiate:  on
RX:             on
TX:             on
RX negotiated: on
TX negotiated: on

root@afs-pve02:~# ip --stats link show ens3f0np0
4: ens3f0np0: <BROADCAST,MULTICAST,UP,LOWER_UP> mtu 9000 qdisc mq state UP mode DEFAULT group default qlen 1000
    link/ether b4:83:51:05:34:2a brd ff:ff:ff:ff:ff:ff
    RX:  bytes packets errors dropped  missed   mcast
    3806298235  480254      0     161       0     161
    TX:  bytes packets errors dropped carrier collsns
      16164600  239722      0       0       0       0
    altname enp216s0f0np0

root@afs-pve02:~# ip --stats link show ens3f1np1
6: ens3f1np1: <BROADCAST,MULTICAST,UP,LOWER_UP> mtu 9000 qdisc mq state UP mode DEFAULT group default qlen 1000
    link/ether b4:83:51:05:34:2b brd ff:ff:ff:ff:ff:ff
    RX:  bytes packets errors dropped  missed   mcast
     247927300   29553      0     161       0     161
    TX:  bytes packets errors dropped carrier collsns
       1178684   15626      0       0       0       0
    altname enp216s0f1np1
This is my
/etc/network/interfaces
Code:
root@afs-pve02:~# cat /etc/network/interfaces
# network interface settings; autogenerated
# Please do NOT modify this file directly, unless you know what
# you're doing.
#
# If you want to manage parts of the network configuration manually,
# please utilize the 'source' or 'source-directory' directives to do
# so.
# PVE will preserve these directives, but will NOT read its network
# configuration from sourced files, so do not attempt to move any of
# the PVE managed interfaces into external files!

auto lo
iface lo inet loopback

iface ens2f0 inet manual

iface ens2f1 inet manual

auto ens3f0np0
iface ens3f0np0 inet static
        address 172.16.20.22/24
        mtu 9000
#Storage Switch 1

auto ens3f1np1
iface ens3f1np1 inet static
        address 172.16.22.22/24
        mtu 9000
#Storage switch 2

auto eno1np0
iface eno1np0 inet manual

auto eno2np1
iface eno2np1 inet manual

auto bond0
iface bond0 inet manual
        bond-slaves eno1np0 eno2np1
        bond-miimon 100
        bond-mode 802.3ad

auto vmbr0
iface vmbr0 inet static
        address 192.168.98.22/26
        gateway 192.168.98.1
        bridge-ports ens2f0
        bridge-stp off
        bridge-fd 0

auto vmbr1v100
iface vmbr1v100 inet manual
        bridge-ports vlan100
        bridge-stp off
        bridge-fd 0

auto vmbr1v101
iface vmbr1v101 inet manual
        bridge-ports vlan101
        bridge-stp off
        bridge-fd 0

auto vmbr1v981
iface vmbr1v981 inet manual
        bridge-ports vlan981
        bridge-stp off
        bridge-fd 0

auto vlan100
iface vlan100 inet manual
        vlan-raw-device bond0

auto vlan101
iface vlan101 inet manual
        vlan-raw-device bond0

auto vlan981
iface vlan981 inet manual
        vlan-raw-device bond0

auto vlan3001
iface vlan3001 inet static
        address 172.16.21.22/24
        vlan-raw-device bond0
#Proxmox Cluster

source /etc/network/interfaces.d/*
The load test returns the following
Code:
root@afs-pve02:~# fio --filename=/dev/sdc --direct=1 --rw=read --bs=1m --size=20G --numjobs=200 --runtime=60 --group_reporting --name=file1
file1: (g=0): rw=read, bs=(R) 1024KiB-1024KiB, (W) 1024KiB-1024KiB, (T) 1024KiB-1024KiB, ioengine=psync, iodepth=1
...
fio-3.33
Starting 200 processes
Jobs: 176 (f=176): [_(1),R(3),_(1),R(3),_(1),R(2),_(1),R(5),E(1),_(1),R(10),_(1),R(10),_(1),R(12),_(1),R(2),_(1),R(9),_(1),R(12),_(2),R(3),E(1),R(2),_(1),R(7),_(1),R(8),E(1),_(1),R(16),_(1),R(13),E(1),_(1),R(7),_(1),R(10),E(1),R(27),_(1),R(15)][5.1%][r=23.9MiB/s][r=23 IOPS][eta 21m:23s]
file1: (groupid=0, jobs=200): err= 0: pid=11893: Mon Mar 24 13:20:34 2025
  read: IOPS=48, BW=48.8MiB/s (51.2MB/s)(3363MiB/68895msec)
    clat (msec): min=4, max=65549, avg=4091.58, stdev=15156.26
     lat (msec): min=4, max=65549, avg=4091.58, stdev=15156.26
    clat percentiles (msec):
     |  1.00th=[   36],  5.00th=[  103], 10.00th=[  131], 20.00th=[  159],
     | 30.00th=[  182], 40.00th=[  203], 50.00th=[  222], 60.00th=[  239],
     | 70.00th=[  271], 80.00th=[  313], 90.00th=[  376], 95.00th=[17113],
     | 99.00th=[17113], 99.50th=[17113], 99.90th=[17113], 99.95th=[17113],
     | 99.99th=[17113]
   bw (  KiB/s): min=501760, max=1229164, per=100.00%, avg=860882.74, stdev=1391.05, samples=1509
   iops        : min=  490, max= 1200, avg=840.60, stdev= 1.36, samples=1509
  lat (msec)   : 10=0.15%, 20=0.36%, 50=0.98%, 100=3.15%, 250=60.12%
  lat (msec)   : 500=28.87%, 750=0.03%, >=2000=6.33%
  cpu          : usr=0.00%, sys=0.00%, ctx=4096, majf=0, minf=53825
  IO depths    : 1=100.0%, 2=0.0%, 4=0.0%, 8=0.0%, 16=0.0%, 32=0.0%, >=64=0.0%
     submit    : 0=0.0%, 4=100.0%, 8=0.0%, 16=0.0%, 32=0.0%, 64=0.0%, >=64=0.0%
     complete  : 0=0.0%, 4=100.0%, 8=0.0%, 16=0.0%, 32=0.0%, 64=0.0%, >=64=0.0%
     issued rwts: total=3363,0,0,0 short=0,0,0,0 dropped=0,0,0,0
     latency   : target=0, window=0, percentile=100.00%, depth=1

Run status group 0 (all jobs):
   READ: bw=48.8MiB/s (51.2MB/s), 48.8MiB/s-48.8MiB/s (51.2MB/s-51.2MB/s), io=3363MiB (3526MB), run=68895-68895msec

Disk stats (read/write):
  sdc: ios=3188/0, merge=0/0, ticks=2604640/0, in_queue=2604640, util=99.76%
root@afs-pve02:~#
When running the load test the following shows up in journalctl
Code:
Mar 24 13:19:38 afs-pve02 kernel:  connection2:0: detected conn error (1020)
Mar 24 13:19:39 afs-pve02 iscsid[1291]: Kernel reported iSCSI connection 2:0 error (1020 - ISCSI_ERR_TCP_CONN_CLOSE: TCP connection closed) state (3)
Mar 24 13:19:42 afs-pve02 iscsid[1291]: connection2:0 is operational after recovery (1 attempts)
Mar 24 13:19:51 afs-pve02 kernel:  connection2:0: detected conn error (1020)
Mar 24 13:19:52 afs-pve02 iscsid[1291]: Kernel reported iSCSI connection 2:0 error (1020 - ISCSI_ERR_TCP_CONN_CLOSE: TCP connection closed) state (3)
Mar 24 13:19:55 afs-pve02 iscsid[1291]: connection2:0 is operational after recovery (1 attempts)
Mar 24 13:20:04 afs-pve02 kernel:  connection2:0: detected conn error (1020)
Mar 24 13:20:05 afs-pve02 iscsid[1291]: Kernel reported iSCSI connection 2:0 error (1020 - ISCSI_ERR_TCP_CONN_CLOSE: TCP connection closed) state (3)
Mar 24 13:20:08 afs-pve02 iscsid[1291]: connection2:0 is operational after recovery (1 attempts)
Mar 24 13:20:17 afs-pve02 kernel:  connection2:0: detected conn error (1020)
Mar 24 13:20:18 afs-pve02 iscsid[1291]: Kernel reported iSCSI connection 2:0 error (1020 - ISCSI_ERR_TCP_CONN_CLOSE: TCP connection closed) state (3)
Mar 24 13:20:21 afs-pve02 iscsid[1291]: connection2:0 is operational after recovery (1 attempts)
Mar 24 13:20:31 afs-pve02 kernel:  connection2:0: detected conn error (1020)
Mar 24 13:20:31 afs-pve02 iscsid[1291]: Kernel reported iSCSI connection 2:0 error (1020 - ISCSI_ERR_TCP_CONN_CLOSE: TCP connection closed) state (3)
Mar 24 13:20:34 afs-pve02 iscsid[1291]: connection2:0 is operational after recovery (1 attempts)
Mar 24 13:20:34 afs-pve02 pvestatd[1630]: status update time (56.267 seconds)
This is what dmesg shows
Code:
root@afs-pve02:~# dmesg -T -W
[Mon Mar 24 13:19:38 2025]  connection2:0: detected conn error (1020)
[Mon Mar 24 13:19:51 2025]  connection2:0: detected conn error (1020)
[Mon Mar 24 13:20:04 2025]  connection2:0: detected conn error (1020)
[Mon Mar 24 13:20:17 2025]  connection2:0: detected conn error (1020)
[Mon Mar 24 13:20:30 2025]  connection2:0: detected conn error (1020)
Hopefully anyone can be of help, i'm loosing my mind over this.

