IO Pressure Stall - Unexplained

lslamp

Member
Aug 14, 2023
17
0
6
Dear Clever People,

I have stumbled into a very strange issue. I have 6 VMs on my server running pve-manager/9.2.3/d0fde103346cf89a (running kernel: 6.8.12-18-pve)
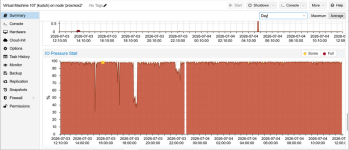
4 of the VMs are running without any hassles what-so-ever. 2 of the VMs are showing a very IO Pressure Stall. like 99%.
On both of the VMs that are seeing this issue are running the following.
Distributor ID: Debian
Description: Debian GNU/Linux 13 (trixie)
Release: 13
Codename: trixie
I have installed node.js
npm version = 11.13.0
pm2 version = 7.0.1
yarn version = 1.22.22
postrgres version = psql (PostgreSQL) 18.4 (Debian 18.4-1.pgdg13+1)psql (PostgreSQL) 18.4 (Debian 18.4-1.pgdg13+1)
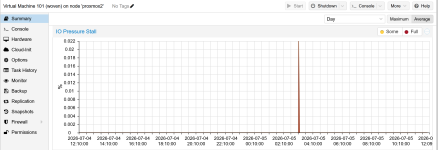
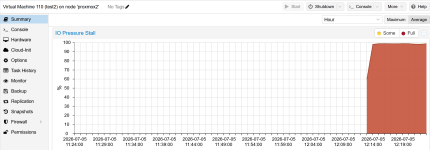
no matter what I try, if I look at the VM in the Proxmox GUI, select the VM / Summary / scroll down to IO Pressure Stall and that shows 99%. I have looked at the history for an hour, a day and a week and they are all the same.
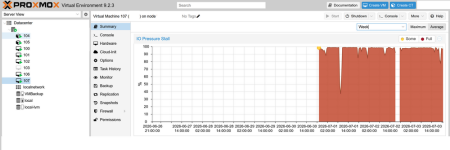
1783104770909.png
The clear verticals was after changing settings and shutting down and then restarting the VM.
Below are the settings I have changed.
change cache to "Write Back"
checked "Discard"
change Async IO "threads"
I have stopped the following services

postgres
nginx
pm2-root

and none of this changes the IO Pressure Stall.
I also tried
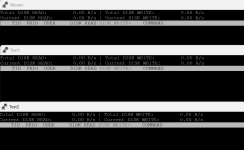
iotop -o -b -n 2
Total DISK READ: 0.00 B/s | Total DISK WRITE: 0.00 B/s
Current DISK READ: 0.00 B/s | Current DISK WRITE: 0.00 B/s
TID PRIO USER DISK READ DISK WRITE SWAPIN IO COMMAND
Total DISK READ: 0.00 B/s | Total DISK WRITE: 0.00 B/s
Current DISK READ: 0.00 B/s | Current DISK WRITE: 0.00 B/s
TID PRIO USER DISK READ DISK WRITE SWAPIN IO COMMAND


I have done loads of searches and chatgpt is saying that this might be that the GUI is not showing what is really happening on the VM.

Does anyone one have any ideas or suggestions.
Thanks
Lawrence
 
I am sorry I don't know how t oadd the text in code blocks

qm config 107

>_agent: 1
boot: order=scsi0;ide2;net0
cores: 4
cpu: x86-64-v2-AES
ide2: none,media=cdrom
memory: 8192
meta: creation-qemu=11.0.0,ctime=1781881657
name: kuduh
net0: virtio=BC:24:11:C3:E8:C7,bridge=vmbr0,firewall=1
numa: 0
ostype: l26
scsi0: VMBackup:107/vm-107-disk-0.qcow2,aio=threads,cache=writeback,discard=on,iothread=1,size=250G,ssd=1
scsihw: virtio-scsi-single
smbios1: uuid=3c9004b2-0248-48e1-8f1d-874feb4d14a1
sockets: 2
vmgenid: 9f2f01ec-2667-467f-81f3-d7759b0252de

8:1 0 1007K 0 part
├─sda2 8:2 0 1G 0 part vfat
└─sda3 8:3 0 6.5T 0 part LVM2_member
├─pve-swap 252:0 0 8G 0 lvm [SWAP] swap
├─pve-root 252:1 0 96G 0 lvm / ext4
├─pve-data_tmeta 252:2 0 10G 0 lvm
│ └─pve-data-tpool 252:4 0 6.4T 0 lvm
│ ├─pve-data 252:5 0 6.4T 1 lvm
│ ├─pve-vm--102--disk--0 252:6 0 500G 0 lvm
│ ├─pve-vm--103--disk--0 252:7 0 100G 0 lvm
│ ├─pve-vm--104--disk--0 252:8 0 58G 0 lvm ext4
│ ├─pve-vm--105--disk--0 252:9 0 58G 0 lvm ext4
│ ├─pve-vm--100--disk--0 252:10 0 40G 0 lvm
│ └─pve-vm--101--disk--0 252:11 0 200G 0 lvm
└─pve-data_tdata 252:3 0 6.4T 0 lvm
└─pve-data-tpool 252:4 0 6.4T 0 lvm
├─pve-data 252:5 0 6.4T 1 lvm
├─pve-vm--102--disk--0 252:6 0 500G 0 lvm
├─pve-vm--103--disk--0 252:7 0 100G 0 lvm
├─pve-vm--104--disk--0 252:8 0 58G 0 lvm ext4
├─pve-vm--105--disk--0 252:9 0 58G 0 lvm ext4
├─pve-vm--100--disk--0 252:10 0 40G 0 lvm
└─pve-vm--101--disk--0 252:11 0 200G 0 lvm
sdb 8:16 0 28.8G 0 disk Internal SD-CARD


cat /etc/pve/storage.cfg
dir: local
path /var/lib/vz
content iso,vztmpl,backup

lvmthin: local-lvm
thinpool data
vgname pve
content rootdir,images
nodes proxmox2

nfs: VMBackup
export /volume1/Backup
path /mnt/pve/VMBackup
server 192.168.1.66
content backup,images,iso,rootdir
prune-backups keep-all=1
 
Last edited:
Code:
qm config 107
agent: 1
boot: order=scsi0;ide2;net0
cores: 4
cpu: x86-64-v2-AES
ide2: none,media=cdrom
memory: 8192
meta: creation-qemu=11.0.0,ctime=1781881657
name: kuduh
net0: virtio=BC:24:11:C3:E8:C7,bridge=vmbr0,firewall=1
numa: 0
ostype: l26
scsi0: local-lvm:vm-107-disk-0,aio=threads,cache=writeback,discard=on,iothread=1,size=250G,ssd=1
scsihw: virtio-scsi-single
smbios1: uuid=3c9004b2-0248-48e1-8f1d-874feb4d14a1
sockets: 2
vmgenid: 9f2f01ec-2667-467f-81f3-d7759b0252de

I have now changed the network to local and it is still the same.
 
Please try with default disk settings so no cache, no aio. Discard is fine. Can you share the IO debugging results as per my first link? You also deleted your message with the other information I asked for...
 
Last edited:
sorry I did not mean to delete anything. Here is what the curreNt status is with the IO Pressure Stall still extremely high

qm config 107

Code:
agent: 1
boot: order=scsi0;ide2;net0
cores: 4
cpu: x86-64-v2-AES
ide2: none,media=cdrom
memory: 16384
meta: creation-qemu=11.0.0,ctime=1781881657
name: kuduh
net0: virtio=BC:24:11:C3:E8:C7,bridge=vmbr0,firewall=1
numa: 0
ostype: l26
scsi0: local-lvm:vm-107-disk-0,iothread=1,size=250G,ssd=1
scsihw: virtio-scsi-single
smbios1: uuid=3c9004b2-0248-48e1-8f1d-874feb4d14a1
sockets: 2
vmgenid: 9f2f01ec-2667-467f-81f3-d7759b0252de

lsblk -o+FSTYPE,LABEL,MODEL

Code:
NAME                         MAJ:MIN RM  SIZE RO TYPE MOUNTPOINTS FSTYPE      LABEL MODEL
sda                            8:0    0  6.5T  0 disk                               LOGICAL VOLUME
├─sda1                         8:1    0 1007K  0 part
├─sda2                         8:2    0    1G  0 part             vfat
└─sda3                         8:3    0  6.5T  0 part             LVM2_member
  ├─pve-swap                 252:0    0    8G  0 lvm  [SWAP]      swap
  ├─pve-root                 252:1    0   96G  0 lvm  /           ext4
  ├─pve-data_tmeta           252:2    0   10G  0 lvm
  │ └─pve-data-tpool         252:4    0  6.4T  0 lvm
  │   ├─pve-data             252:5    0  6.4T  1 lvm
  │   ├─pve-vm--102--disk--0 252:6    0  500G  0 lvm
  │   ├─pve-vm--103--disk--0 252:7    0  100G  0 lvm
  │   ├─pve-vm--104--disk--0 252:8    0   58G  0 lvm              ext4
  │   ├─pve-vm--105--disk--0 252:9    0   58G  0 lvm              ext4
  │   ├─pve-vm--100--disk--0 252:10   0   40G  0 lvm
  │   ├─pve-vm--101--disk--0 252:11   0  200G  0 lvm
  │   ├─pve-vm--107--disk--0 252:12   0  250G  0 lvm
  │   └─pve-vm--106--disk--0 252:13   0  250G  0 lvm
  └─pve-data_tdata           252:3    0  6.4T  0 lvm
    └─pve-data-tpool         252:4    0  6.4T  0 lvm
      ├─pve-data             252:5    0  6.4T  1 lvm
      ├─pve-vm--102--disk--0 252:6    0  500G  0 lvm
      ├─pve-vm--103--disk--0 252:7    0  100G  0 lvm
      ├─pve-vm--104--disk--0 252:8    0   58G  0 lvm              ext4
      ├─pve-vm--105--disk--0 252:9    0   58G  0 lvm              ext4
      ├─pve-vm--100--disk--0 252:10   0   40G  0 lvm
      ├─pve-vm--101--disk--0 252:11   0  200G  0 lvm
      ├─pve-vm--107--disk--0 252:12   0  250G  0 lvm
      └─pve-vm--106--disk--0 252:13   0  250G  0 lvm
sdb                            8:16   0 28.8G  0 disk                               Internal SD-CARD

cat /etc/pve/storage.cfg

Code:
dir: local
        path /var/lib/vz
        content iso,vztmpl,backup

lvmthin: local-lvm
        thinpool data
        vgname pve
        content rootdir,images
        nodes proxmox2

nfs: VMBackup
        export /volume1/Backup
        path /mnt/pve/VMBackup
        server 192.168.1.66
        content backup,images,iso,rootdir
        prune-backups keep-all=1

iostat -xz 1 | grep util

Code:
Device            r/s     rkB/s   rrqm/s  %rrqm r_await rareq-sz     w/s     wkB/s   wrqm/s  %wrqm w_await wareq-sz     d/s     dkB/s   drqm/s  %drqm d_await dareq-sz     f/s f_await  aqu-sz  %util

iotop -o -b -n 2

Code:
Total DISK READ:         0.00 B/s | Total DISK WRITE:         0.00 B/s
Current DISK READ:       0.00 B/s | Current DISK WRITE:       0.00 B/s
    TID  PRIO  USER     DISK READ  DISK WRITE  SWAPIN      IO    COMMAND
Total DISK READ:         0.00 B/s | Total DISK WRITE:         0.00 B/s
Current DISK READ:       0.00 B/s | Current DISK WRITE:      15.85 K/s
    TID  PRIO  USER     DISK READ  DISK WRITE  SWAPIN      IO    COMMAND


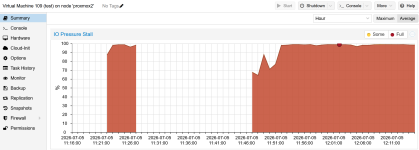
Current view
the gaps I think are there after shutting down and restarting.
1783159817031.png


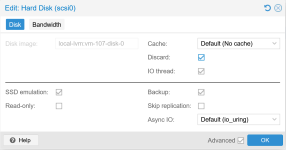
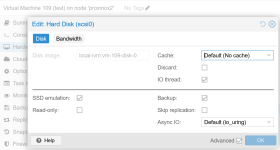
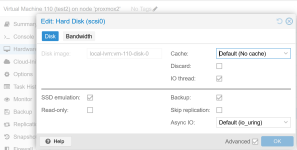
Below my hard disk setting all reverted as requested.
1783159925863.png

Thanks
Lawrence
 
Please share what you see when using the exact commands I documented. Inside the Guest and on the node. This isn't really helpful data. Your iotop doesn't tell me which processes cause IO and your iostat isn't even showing any values. What sticks out is LOGICAL VOLUME. How is that RAID assembled? What hardware is used?
 
Last edited:
I have an HP DL360 gen9 server running the following

Smart Array P440ar in Slot 0 (Embedded)
Internal Drive Cage at Port 1I, Box 1 (Index 0), OK
Internal Drive Cage at Port 2I, Box 1 (Index 1), OK
Port Name: 1I
Port Name: 2I
Array A (SAS, Unused Space: 2 MB)
logicaldrive 1 (6.55 TB, RAID 6, OK)
physicaldrive 1I:1:1 (port 1I:box 1:bay 1, SAS HDD, 1.2 TB, OK)
physicaldrive 1I:1:2 (port 1I:box 1:bay 2, SAS HDD, 1.2 TB, OK)
physicaldrive 1I:1:3 (port 1I:box 1:bay 3, SAS HDD, 1.2 TB, OK)
physicaldrive 1I:1:4 (port 1I:box 1:bay 4, SAS HDD, 1.2 TB, OK)
physicaldrive 2I:1:5 (port 2I:box 1:bay 5, SAS HDD, 1.2 TB, OK)
physicaldrive 2I:1:6 (port 2I:box 1:bay 6, SAS HDD, 1.2 TB, OK)
physicaldrive 2I:1:7 (port 2I:box 1:bay 7, SAS HDD, 1.2 TB, OK)
physicaldrive 2I:1:8 (port 2I:box 1:bay 8, SAS HDD, 1.2 TB, OK)

On this server I have 7 VMs. 5 are all good with no hassles and only two that are running nginx and node.js both have this issue.
All the other VMs are running and have no issues.

I am going to create a new VM from scratch and see what the results are.

is there something in particular that I can do and show you the results to help you think.

Also I have pasted exactly what the output was. I see nothing more.
the two extra commands I added were things that chatgpt suggested to provide.

the command
Code:
iostat -xz 1 | grep util
loops every 1 second and shows nothing because there is no disk utilised. which contradicts what the GUI is saying

Sorry for the hassles.
Lawrence
 
Last edited:
iostat -xz 1 | grep util
This is not one of my commands though. Leave the grep away.
shows nothing because there is no disk utilised
It shows nothing because you grep specifically for the column header. This snippet doesn't work for me either.
is there something in particular that I can do and show you the results to help you think.
Again, use my exact steps/commands or I cannot help you. Also do the same steps inside the VM. We don't need ChatGPT here.


Just for comparison, can you share the config of another VM that doesn't have this issue?
Also can you tell me the HDD models?
 
Last edited:
I am very sorry but I have provided you the output of all your 3 commends below or am I missing something

Code:
qm config 107
lsblk -o+FSTYPE,LABEL,MODEL
cat /etc/pve/storage.cfg

if I understand correctly, these 3 commands should be run on the proxmox server and not teh VM.

qu config 107
output
Code:
agent: 1
boot: order=scsi0;ide2;net0
cores: 4
cpu: x86-64-v2-AES
ide2: none,media=cdrom
memory: 16384
meta: creation-qemu=11.0.0,ctime=1781881657
name: kuduh
net0: virtio=BC:24:11:C3:E8:C7,bridge=vmbr0,firewall=1
numa: 0
ostype: l26
scsi0: local-lvm:vm-107-disk-0,discard=on,iothread=1,size=250G,ssd=1
scsihw: virtio-scsi-single
smbios1: uuid=3c9004b2-0248-48e1-8f1d-874feb4d14a1
sockets: 2
vmgenid: 9f2f01ec-2667-467f-81f3-d7759b0252de

qm config 107
lsblk -o+FSTYPE,LABEL,MODEL
cat /etc/pve/storage.cfg

Code:
NAME                         MAJ:MIN RM  SIZE RO TYPE MOUNTPOINTS FSTYPE      LABEL MODEL
sda                            8:0    0  6.5T  0 disk                               LOGICAL VOLUME
├─sda1                         8:1    0 1007K  0 part
├─sda2                         8:2    0    1G  0 part             vfat
└─sda3                         8:3    0  6.5T  0 part             LVM2_member
  ├─pve-swap                 252:0    0    8G  0 lvm  [SWAP]      swap
  ├─pve-root                 252:1    0   96G  0 lvm  /           ext4
  ├─pve-data_tmeta           252:2    0   10G  0 lvm
  │ └─pve-data-tpool         252:4    0  6.4T  0 lvm
  │   ├─pve-data             252:5    0  6.4T  1 lvm
  │   ├─pve-vm--102--disk--0 252:6    0  500G  0 lvm
  │   ├─pve-vm--103--disk--0 252:7    0  100G  0 lvm
  │   ├─pve-vm--104--disk--0 252:8    0   58G  0 lvm              ext4
  │   ├─pve-vm--105--disk--0 252:9    0   58G  0 lvm              ext4
  │   ├─pve-vm--100--disk--0 252:10   0   40G  0 lvm
  │   ├─pve-vm--101--disk--0 252:11   0  200G  0 lvm
  │   ├─pve-vm--107--disk--0 252:12   0  250G  0 lvm
  │   ├─pve-vm--106--disk--0 252:13   0  250G  0 lvm
  │   └─pve-vm--108--disk--0 252:14   0  220G  0 lvm
  └─pve-data_tdata           252:3    0  6.4T  0 lvm
    └─pve-data-tpool         252:4    0  6.4T  0 lvm
      ├─pve-data             252:5    0  6.4T  1 lvm
      ├─pve-vm--102--disk--0 252:6    0  500G  0 lvm
      ├─pve-vm--103--disk--0 252:7    0  100G  0 lvm
      ├─pve-vm--104--disk--0 252:8    0   58G  0 lvm              ext4
      ├─pve-vm--105--disk--0 252:9    0   58G  0 lvm              ext4
      ├─pve-vm--100--disk--0 252:10   0   40G  0 lvm
      ├─pve-vm--101--disk--0 252:11   0  200G  0 lvm
      ├─pve-vm--107--disk--0 252:12   0  250G  0 lvm
      ├─pve-vm--106--disk--0 252:13   0  250G  0 lvm
      └─pve-vm--108--disk--0 252:14   0  220G  0 lvm
sdb                            8:16   0 28.8G  0 disk                               Internal SD-CARD

cat /etc/pve/storage.cfg

Code:
dir: local
        path /var/lib/vz
        content iso,vztmpl,backup

lvmthin: local-lvm
        thinpool data
        vgname pve
        content rootdir,images
        nodes proxmox2

nfs: VMBackup
        export /volume1/Backup
        path /mnt/pve/VMBackup
        server 192.168.1.66
        content backup,images,iso,rootdir
        prune-backups keep-all=1
 
ok I have been pretty busy trying to understand what is going on.
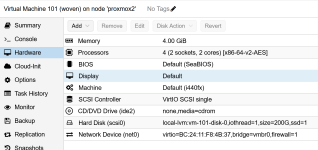
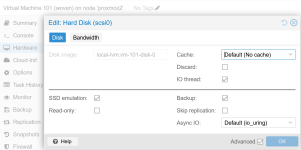
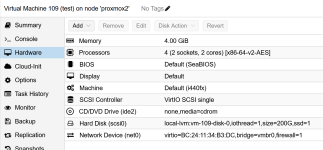
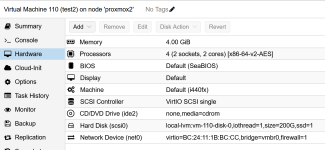
I have a VM 101 see below.
1783246199562.png

1783246237469.png

1783246276643.png

I created two clones of this VM canned then 109 and 110

I have VM 109 below
On VM 109, the only change I made was select Discard under Disk Config and saw that the IO Pressure Stall jumped up almost straight away. I then tried to unselct it to see if that would remove the high rise. This did not happen. It stayed high.
1783246568219.png

1783246592574.png

1783246616330.png

So as a test I cloned 101 again and created VM 110. See below.
I have made no changes to this clone and I see that the IO Pressure Stall also goes high as soon as you start it.

1783247057668.png

1783247082541.png

1783247100300.png

I ran some of the tests that I found on the page ....

1783249646605.png
 
Last edited:
I seem to have hit the limit of 10 uploads. I will try to remove the uploads and zip them into a single file to view the results of the different tests
 
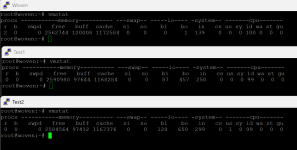
is this what you are looking for

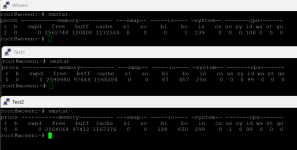
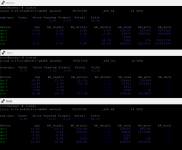
1783251946882.png

1783251975155.png

1783251997613.png

With my lack of knowledge and understanding. IT does not seem that the same information is showing on the commandline as whet you see in the GUI. Is this correct?

this is without full understanding mind.
Thanks in advance and you patience with my ignorance and not understanding
 
Last edited:
No it is not. You did not use the commands and the given arguments on the linked page. I can't see the disk utilization. It also looks like you used iotop instead of iotop-c. Which commands did you use? Did you boot with delayacct? It's possible that HW RAID doesn't expose IO stats properly. Not sure.
 
Last edited:
  • Like
Reactions: lslamp
I have put together a bash script that delivers I hope what you need.

the VMs that are seeing the issue are 100, 106, 107, 108, 109 and 110
the VMs that do not have the issue are 101, 102 and 103

Please let me know if you need more info.

Thanks
Lawrence
 

Attachments