io delay 90% - its norm, or bad?

Mar 17, 2016
24
1
23
42
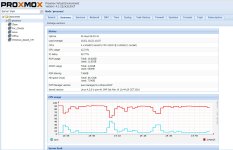
The image shows a mirror image between the CPU load and IOwait in grapg - is this normal? But in status IOdelay -- 90%. Are they (IOwait and IOdelay ) not inversely proportional?

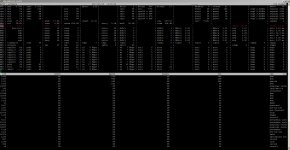
And another question - why is the swap file used, if even more than 7 gigabytes of RAM is free?
 

Attachments

  • 2017-05-29 14 47 24.jpg
    2017-05-29 14 47 24.jpg
    408.5 KB · Views: 32
  • 2017-05-29 14 58 29.jpg
    2017-05-29 14 58 29.jpg
    726.8 KB · Views: 27
I have once hdd for system, 2 hdd (for VMs and backups ) combined in RAID-1 by mdadm.
root@proxmox:~# pveperf
CPU BOGOMIPS: 19201.04
REGEX/SECOND: 1045794
HD SIZE: 56.72 GB (/dev/dm-0)
BUFFERED READS: 31.33 MB/sec
AVERAGE SEEK TIME: 15.26 ms
FSYNCS/SECOND: 26.44
DNS EXT: 108.70 ms
DNS INT: 0.78 ms (hal.local)
root@proxmox:~#

root@proxmox:~# df -T
Файловая система Тип 1K-блоков Использовано Доступно Использовано% Cмонтировано в
udev devtmpfs 10240 0 10240 0% /dev
tmpfs tmpfs 4110272 202908 3907364 5% /run
/dev/dm-0 ext3 59474060 7907088 48539212 15% /
tmpfs tmpfs 10275672 43680 10231992 1% /dev/shm
tmpfs tmpfs 5120 0 5120 0% /run/lock
tmpfs tmpfs 10275672 0 10275672 0% /sys/fs/cgroup
/dev/sdd1 ext4 480589544 212588452 243565432 47% /hdd2tb
/dev/md0 ext3 1922600632 771352312 1053579156 43% /storage
/dev/sda1 ext3 498532 56948 415421 13% /boot
/dev/mapper/pve-data ext3 158549756 67256812 91292944 43% /var/lib/vz
//192.168.0.102/install/ISO/Proxmox_Install cifs 894019393 144673003 749346390 17% /hdd2tb/template/iso
tmpfs tmpfs 100 0 100 0% /run/lxcfs/controllers
cgmfs tmpfs 100 0 100 0% /run/cgmanager/fs
/dev/fuse fuse 30720 40 30680 1% /etc/pve
192.168.0.127:/mnt/pool/servers/proxmox nfs 6395954176 3387623296 3008330880 53% /mnt/pve/nfs
tmpfs tmpfs 2055136 0 2055136 0% /run/user/0

root@proxmox:~# cat /proc/mdstat
Personalities : [raid1]
md0 : active raid1 sdb1[0] sdc1[1]
1953383296 blocks super 1.2 [2/2] [UU]

unused devices: <none>
 
Ok, yes this is normal. The system have not enough power. 2 Disk and backup on same machine, that can't go fine.
BUFFERED READS: 31.33 MB/sec
AVERAGE SEEK TIME: 15.26 ms
FSYNCS/SECOND: 26.44
31,33 MB/s is not really much. And fsync should me much more higher. A good value is about 3000 upward. For example here two servers.

Littel HP with 4 SATA Disks in Raid10
Code:
CPU BOGOMIPS:      24742.04
REGEX/SECOND:      1524866
HD SIZE:           9.72 GB (/dev/dm-0)
BUFFERED READS:    188.50 MB/sec
AVERAGE SEEK TIME: 7.78 ms
FSYNCS/SECOND:     5259.39
DNS EXT:           44.98 ms

Or an Supermicro with 6 SATA Disk in ZFS Raid10
Code:
CPU BOGOMIPS:      40002.00
REGEX/SECOND:      2686294
HD SIZE:           1920.82 GB (v-machines)
FSYNCS/SECOND:     6812.31
DNS EXT:           61.02 ms
The Systems Performance is not always depending on these values, but you read that you can have problem with your hardware. Or
not enough / to little harddrives.
And the last thing: Softraid with mdadm is not supportet... but yes should also work ;) with more disks, or some Enterprise SSD's.
I recommend, that you upgrade to newest PVEversion too In the course of the hardware change / upgrade.

Please Post the details of your HDD's
Code:
smartctl -a /dev/sda
smartctl -a /dev/sdb
smartctl -a /dev/sdc
 

About

The Proxmox community has been around for many years and offers help and support for Proxmox VE, Proxmox Backup Server, and Proxmox Mail Gateway.
We think our community is one of the best thanks to people like you!

Get your subscription!

The Proxmox team works very hard to make sure you are running the best software and getting stable updates and security enhancements, as well as quick enterprise support. Tens of thousands of happy customers have a Proxmox subscription. Get yours easily in our online shop.

Buy now!