[SOLVED] Interruptions in the performance graphs of VMs and VMs are sometimes shown with an unknown state

Jan 27, 2021
4
3
3
40
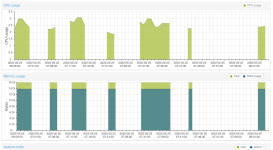
We recently discovered a strange behavior after a power outage a week or so ago. Since this (or at least it popped up after this), performance data of VMs has interruptions. Screenshot:
Performance_Graphs.png

The web GUI also displays VMs with an unknown status for a short period, although they are running and reachable. We updated yesterday to the latest packages of 6.4-14, but this didn't change the behavior. I have seen reported issues with QNAP, but this is a Synology, and I'm not aware of a noticeable change in the last weeks.

I would greatly appreciate any tips :)
 
seem that the pvestatd service is hanging (maybe on your qnap).

the pvestatd service make a sequential loop

- status of host
- status of vms
- status of storage

if a storage is hanging, it can block the pvestatd daemon, and you'll also don't have others stats.

about your qnap, do you have mounted it manually in /etc/fstab ? or simply declare it as nfs in /etc/pve/storage.cfg ?
 
@spirit thanks for the hint in the right direction!

Problem is not related to the Proxmox hosts or the backing NFS storage from Synology. The pvestatd was reporting error messages that it couldn't send it's data to the metric server / influxdb. Once that was fixed, all graphs are fine now again.

Cheers!
 

About

The Proxmox community has been around for many years and offers help and support for Proxmox VE, Proxmox Backup Server, and Proxmox Mail Gateway.
We think our community is one of the best thanks to people like you!

Get your subscription!

The Proxmox team works very hard to make sure you are running the best software and getting stable updates and security enhancements, as well as quick enterprise support. Tens of thousands of happy customers have a Proxmox subscription. Get yours easily in our online shop.

Buy now!