Hi,
I'm new here since I've started using Proxmox VE and PBS 2 weeks ago, but I've already done some questions on other threads and received very useful hints from you. So it is time to give something back (nothing exceptional, just my 2 cents).
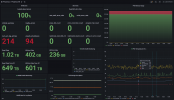
I'm running a TIG stack (Telegraf-InfluxDB2-Grafana) in my home network and I wanted to monitor PVE status. I've configured the metrics server from GUI but then I wanted to add some useful info about temperatures of CPU and disks and about the health of the NVME and SATA disks I have in my Intel Nuc i7 10th Gen box.
You can find my Python scripts with some notes in the README.md file on my GitHub profile at the following page:
MightySlaytanic/pve-monitoring
Feel free to download and modify them to fit your needs.

Last edited:

