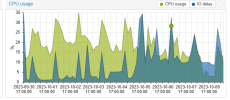
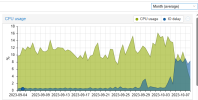
Insane high IO delay without reason
- Thread starter spleenftw
- Start date
You are using an out of date browser. It may not display this or other websites correctly.
You should upgrade or use an alternative browser.
You should upgrade or use an alternative browser.
Oh nvm, finally saw something :
```
Oct 09 11:09:20 pivoine kernel: ata2.00: exception Emask 0x10 SAct 0xc0 SErr 0x280100 action 0x6 frozen
Oct 09 11:09:20 pivoine kernel: ata2.00: irq_stat 0x08000000, interface fatal error
Oct 09 11:09:20 pivoine kernel: ata2: SError: { UnrecovData 10B8B BadCRC }
Oct 09 11:09:20 pivoine kernel: ata2.00: failed command: READ FPDMA QUEUED
Oct 09 11:09:20 pivoine kernel: ata2.00: cmd 60/78:30:f8:e1:00/00:00:64:00:00/40 tag 6 ncq dma 61440 in res 40/00:38:78:e2:00/00:00:64:00:00/40 Emask 0x10 (ATA bus error)
Oct 09 11:09:20 pivoine kernel: ata2.00: status: { DRDY }
Oct 09 11:09:20 pivoine kernel: ata2.00: failed command: READ FPDMA QUEUED
Oct 09 11:09:20 pivoine kernel: ata2.00: cmd 60/20:38:78:e2:00/00:00:64:00:00/40 tag 7 ncq dma 16384 in res 40/00:38:78:e2:00/00:00:64:00:00/40 Emask 0x10 (ATA bus error)
Oct 09 11:09:20 pivoine kernel: ata2.00: status: { DRDY }
Oct 09 11:09:20 pivoine kernel: ata2: hard resetting link
Oct 09 11:09:21 pivoine kernel: ata2: SATA link up 1.5 Gbps (SStatus 113 SControl 310)
Oct 09 11:09:21 pivoine kernel: ata2.00: supports DRM functions and may not be fully accessible
Oct 09 11:09:21 pivoine kernel: ata2.00: supports DRM functions and may not be fully accessible
Oct 09 11:09:21 pivoine kernel: ata2.00: configured for UDMA/33
Oct 09 11:09:21 pivoine kernel: ata2: EH complete
Oct 09 11:09:21 pivoine kernel: ata2.00: Enabling discard_zeroes_data
```
```
Oct 09 11:09:20 pivoine kernel: ata2.00: exception Emask 0x10 SAct 0xc0 SErr 0x280100 action 0x6 frozen
Oct 09 11:09:20 pivoine kernel: ata2.00: irq_stat 0x08000000, interface fatal error
Oct 09 11:09:20 pivoine kernel: ata2: SError: { UnrecovData 10B8B BadCRC }
Oct 09 11:09:20 pivoine kernel: ata2.00: failed command: READ FPDMA QUEUED
Oct 09 11:09:20 pivoine kernel: ata2.00: cmd 60/78:30:f8:e1:00/00:00:64:00:00/40 tag 6 ncq dma 61440 in res 40/00:38:78:e2:00/00:00:64:00:00/40 Emask 0x10 (ATA bus error)
Oct 09 11:09:20 pivoine kernel: ata2.00: status: { DRDY }
Oct 09 11:09:20 pivoine kernel: ata2.00: failed command: READ FPDMA QUEUED
Oct 09 11:09:20 pivoine kernel: ata2.00: cmd 60/20:38:78:e2:00/00:00:64:00:00/40 tag 7 ncq dma 16384 in res 40/00:38:78:e2:00/00:00:64:00:00/40 Emask 0x10 (ATA bus error)
Oct 09 11:09:20 pivoine kernel: ata2.00: status: { DRDY }
Oct 09 11:09:20 pivoine kernel: ata2: hard resetting link
Oct 09 11:09:21 pivoine kernel: ata2: SATA link up 1.5 Gbps (SStatus 113 SControl 310)
Oct 09 11:09:21 pivoine kernel: ata2.00: supports DRM functions and may not be fully accessible
Oct 09 11:09:21 pivoine kernel: ata2.00: supports DRM functions and may not be fully accessible
Oct 09 11:09:21 pivoine kernel: ata2.00: configured for UDMA/33
Oct 09 11:09:21 pivoine kernel: ata2: EH complete
Oct 09 11:09:21 pivoine kernel: ata2.00: Enabling discard_zeroes_data
```
Just install and run iotop and look at the processes currently doing I/O. A high I/O load is NOT logged, because the system cannot say what is high and what is not. Therefore you normally would use external monitoring to check if - as star trek already told us decades ago - is operating within normal parameters.
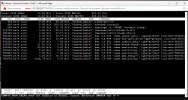
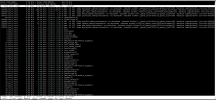
What is mo/s? I/O is not about throughtput, it's about I/O operations per second and its access pattern, e.g. a enterprise class harddisk with 15 krpm is only capable of 200 random I/O per second, which yields with a 512 byte blocksize only roughly 100 KB/s, which is VERY low, but the I/O wait delay would be 100%. So just bare MB/s is not enough.So i installed iotop and looked at it for like 5 mins, but there's nothing outstanding. The max current disk read i had was 12mo/s and the max current disk write i had was 2mo/s
What processes are there in the iotop output and what is the purpose of those processes / machines?
Now we know what machines cause those high IO load. You now need to inspect them further, e.g. also with iotop inside of the VMs.
the thing is the "ranking" is just perma changing, so i'm not sure about what vms is really causing those high I/O loadNow we know what machines cause those high IO load. You now need to inspect them further, e.g. also with iotop inside of the VMs.
Then accumulate it:the thing is the "ranking" is just perma changing, so i'm not sure about what vms is really causing those high I/O load
Code:
iotop -aoPI moved Zabbix from HDD to SSD because Zabbix is writing insane amounts of metrics to the MySQL/PostgreSQL DB which my HDD couldn't handle. Shouldn' be much better with PBS (doing a GC) and Wazuh (collecting logs and metrics in DBs).
Last edited:
Yes, we also had this years ago. Monitoring was by far the most I/O hungry VM we had, more than everything else combined.I moved Zabbix from HDD to SSD because Zabbix is writing insane amounts of metrics to the MySQL/PostgreSQL DB which my HDD couldn't handle. Shouldn' be much better with PBS (doing a GC) and Wazuh (collecting logs and metrics in DBs).
Oh nvm, finally saw something :
```
Oct 09 11:09:20 pivoine kernel: ata2.00: exception Emask 0x10 SAct 0xc0 SErr 0x280100 action 0x6 frozen
Oct 09 11:09:20 pivoine kernel: ata2.00: irq_stat 0x08000000, interface fatal error
Oct 09 11:09:20 pivoine kernel: ata2: SError: { UnrecovData 10B8B BadCRC }
Oct 09 11:09:20 pivoine kernel: ata2.00: failed command: READ FPDMA QUEUED
Oct 09 11:09:20 pivoine kernel: ata2.00: cmd 60/78:30:f8:e1:00/00:00:64:00:00/40 tag 6 ncq dma 61440 in res 40/00:38:78:e2:00/00:00:64:00:00/40 Emask 0x10 (ATA bus error)
Oct 09 11:09:20 pivoine kernel: ata2.00: status: { DRDY }
Oct 09 11:09:20 pivoine kernel: ata2.00: failed command: READ FPDMA QUEUED
Oct 09 11:09:20 pivoine kernel: ata2.00: cmd 60/20:38:78:e2:00/00:00:64:00:00/40 tag 7 ncq dma 16384 in res 40/00:38:78:e2:00/00:00:64:00:00/40 Emask 0x10 (ATA bus error)
Oct 09 11:09:20 pivoine kernel: ata2.00: status: { DRDY }
Oct 09 11:09:20 pivoine kernel: ata2: hard resetting link
Oct 09 11:09:21 pivoine kernel: ata2: SATA link up 1.5 Gbps (SStatus 113 SControl 310)
Oct 09 11:09:21 pivoine kernel: ata2.00: supports DRM functions and may not be fully accessible
Oct 09 11:09:21 pivoine kernel: ata2.00: supports DRM functions and may not be fully accessible
Oct 09 11:09:21 pivoine kernel: ata2.00: configured for UDMA/33
Oct 09 11:09:21 pivoine kernel: ata2: EH complete
Oct 09 11:09:21 pivoine kernel: ata2.00: Enabling discard_zeroes_data
```
IMHO, this seems to point to a failing disk/cable/controller related to drive "ata2". This may cause the drive and the controller to respond slower and create a higher I/O wait. Did you check all drives with smartctl? I would also replug all cables, just in case.
the mdadm -D :IMHO, this seems to point to a failing disk/cable/controller related to drive "ata2". This may cause the drive and the controller to respond slower and create a higher I/O wait. Did you check all drives with smartctl? I would also replug all cables, just in case.
```
root@pivoine:~# mdadm -D /dev/md127
/dev/md127:
Version : 1.2
Creation Time : Thu May 18 18:43:55 2023
Raid Level : raid1
Array Size : 1953382464 (1862.89 GiB 2000.26 GB)
Used Dev Size : 1953382464 (1862.89 GiB 2000.26 GB)
Raid Devices : 2
Total Devices : 2
Persistence : Superblock is persistent
Intent Bitmap : Internal
Update Time : Mon Oct 9 12:54:44 2023
State : active
Active Devices : 2
Working Devices : 2
Failed Devices : 0
Spare Devices : 0
Consistency Policy : bitmap
Name : pivoine:0 (local to host pivoine)
UUID : dc761298:6b4b036e:d1020eb2:a33ea945
Events : 50222
Number Major Minor RaidDevice State
0 8 0 0 active sync /dev/sda
1 8 16 1 active sync /dev/sdb
```
they're running on SSD SATA tho...I moved Zabbix from HDD to SSD because Zabbix is writing insane amounts of metrics to the MySQL/PostgreSQL DB which my HDD couldn't handle. Shouldn' be much better with PBS (doing a GC) and Wazuh (collecting logs and metrics in DBs).


