Hello.
I have set up the network through OVS.
However, communication with other PCs is not working normally.
Checking the reason, inbound broadcast packets are dropped.
# ovs-vsctl show
Bash:
    Bridge "vmbr1"
        Port "vmbr1"
            Interface "vmbr1"
                type: internal
        Port "enp5s0" <= Trunk Port
            Interface "enp5s0"
        Port "veth1"
            tag: 10
            Interface "veth1"
                type: internal
    ovs_version: "2.12.0"
You are correct about RSTP is not supported by the Linux bridge model.
May MSTPD[1] is a solution to this problem.
But why in a Layer2 network use RSTP instead of a bond with active-backup?
Or do you build trees with your nodes?
OVS is known to be not perfectly stable. This is the reason why I personally would avoid using OVS.
Sure, if there is a need that can't find a workaround, you have to use it.
- I have a port similar to veth1 (vlan128 in my case) above and I can reach it correctly from (almost) any other system on the network.
- I also have a container running on the same VLAN and it's also reachable from any other system on the network.
Unfortunately, my second Proxmox host is not able to reach veth1 - it is able to reach the LXC container on the other host.
Looking at the two interfaces, I get the following info from OVS:
Code:
root@pve01:~# ovs-vsctl get port vlan128 rstp_status
{}

root@pve01:~# ovs-vsctl get port veth8101i0 rstp_status
{rstp_designated_bridge_id="8.000.ac1f6b769634", rstp_designated_path_cost="30000", rstp_designated_port_id="8006", rstp_port_id="8006", rstp_port_role=Designated, rstp_port_state=Forwarding}
Apparently, the port & interface that are being created for the LCX container are created in such a way, that they properly participate in the RSTP setup, while the port & interface created directly out of /etc/network/interfaces are not.
Any idea would be greatly appreciated as the system is working otherwise. Actually, it was running yesterday but unfortunately a restart resulted in the above scenario.
I'm observing packet loss on vmbr1 and ruled out the firewall and switches involved (tested and verified with iperf3 in UDP mode and manually checking with snmp).
I'm using OVS... my only gripe at moment is that I initially moved to OVS so I could configure spans/mirror ports for some VM guest NICs.
If this can be done with standard Linux bridges I would happily move back, and I can also try to help debug the issue (but so far it seems obscure, all I can say is that it's been narrowed down to the OVS bridge). It manifests as packet loss from within containers to the outside world.
Edited: adding iperf3 UDP between the host and one of its guests on a different vlan:
Just wanting to contribute to this discussion my own experience with OVS, for future reference in the case someone else bump into this problem again. I also have the very same issue reported here, with incoming packets being dropped for no apparent reason at all. I'm currently using Open vSwitch v2.15.0+ds1-2, installed on my homelab Proxmox VE 7.0-13 which is setup as a standalone node. My virtual networking uses an OVS bridge to which everything else is connected. By "everything else" I mean:
The physical ethernet NIC of the server (just a consumer-grade computer) configured as OVSPort and used by a OVSIntPort for accessing the Proxmox VE host itself.
Three VMs with two NICs each. One NIC is meant for external communication and the other one for exclusive internal networking through a VLAN.
Two VLANs, internally set as OVSIntPorts, although I currently use only one of them.
A K3s Kubernetes cluster running in those VMs, using the VLANed NICs of the VMs for internal cluster networking.
My experience with this setup has been the following.
The Proxmox VE host and the VMs are usually reachable, but when trying to access any of them (like through SSH for opening a remote shell) the firewall usually reports at least one DROP or two, although the connection usually ends being stablished.
Once in a while the established connection with the PVE host or the VMs will misteriously drop on its own.
The DROP issue gets noticeably much worse when trying to access the apps I expose with external IPs (within my own home network) on my Kubernetes cluster. A few times I can access them, most of the times not, and the firewall reports many more DROP packets in those cases.
There doesn't seem to be any kind of issue with the internal networking of my cluster, the one that goes through the VLANed interfaces on my VMs.
Overall, it seems that, the deeper you try to reach in the network, so to speak, the worse it gets. On the other hand, I tried by adjusting sysctl net parameters, with no apparent effect whatsoever on the issue.
Also for reference, I'll leave here the current /etc/network/interfaces file applied on my Proxmox VE host.
Bash:
auto lo
iface lo inet loopback

auto enp2s0
iface enp2s0 inet manual
        ovs_type OVSPort
        ovs_bridge vmbr0

iface wlp3s0 inet manual

auto pve_inband
iface pve_inband inet static
        address x.x.x.27/24
        gateway x.x.x.1
        ovs_type OVSIntPort
        ovs_bridge vmbr0
#PVE's in-band management port

auto vlan1
iface vlan1 inet manual
        ovs_type OVSIntPort
        ovs_bridge vmbr0
        ovs_options tag=1
#First VLAN

auto vlan2
iface vlan2 inet manual
        ovs_type OVSIntPort
        ovs_bridge vmbr0
        ovs_options tag=2
#Second VLAN

auto vmbr0
iface vmbr0 inet manual
        ovs_type OVSBridge
        ovs_ports enp2s0 pve_inband vlan1 vlan2
On my part, and following the recommendation indicated by @wolfgang , I'll try to reconfigure my virtual network following the Linux bridge model and report here my experience (if I'm successful...).
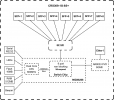
I must check in with some news: my problems seem to have been compounded by two things, one is OVS, the other is PHY-related with a Mikrotik L2 switch:
The ethboot port (PoE input) is 1g and connected to its own PHY, which is "bridged" to the 10G PHY. I used it untagged in an isolated VLAN for only network management interfaces and to supply PoE direct from an enterprise level L3 switch that does PoE.
OVS with a dedicated NIC and cpufreq actually knocking down p-states into the 100nth MHz level (yeah...).
Regarding the Mikrotik issue, it's a serious problem because it: 1) does not manifest visibly anywhere (no logs, no dropped packets in the stats) 2) there is absolutely no indication of foul play, although enabling STP on the ethboot port might manifest before the other problems.
What happens is that, once you use the same VLAN for the ethboot in a tagged trunk port, the 10G PHY and 1G PHY become "bridged" and cpu-bound (thank you z for bringing up this possibility when I was out of ideas!!!). Mikrotik claims that this is "fine". Well, it isn't. Internally this causes packet reordering and "contention" between both PHYs apparently, and that lone VLAN suffers packet loss that is not reflected anywhere, but will be detectable with iperf UDP testing and stability issues. A "packet goblin" kind of problem.
So, PSA: do NOT use the VLAN you use for ethboot/mgmt anywhere else if the ports are connected to a different PHY, regardless of what Mikrotik might say.
I will keep ruling out problems because I still observe some packet loss that is 100% impossible to blame on the switches or firewall, but it is much more bearable and now my NMS nodes aren't crapping out at me.
Happy to help if I can. Thank you @ Proxmox staff for the amazing product!
Edit: this diagram is related to what I described about the Mikrotik PHY and z mentioned, including the diagram itself. TL;DR it is BLOCKING, don't believe Mikrotik for a moment in this one.
Thanks @xed for your details, although with my limited knowledge on networking there are notions you mention that I don't know about. But I'm going to tell you something I think you and any other still paying attention to this thread might find interesting.
I've changed my virtual network configuration to use a Linux Bridge, essentially reverting to the original default configuration that Proxmox VE comes with when newly installed. This means just one vmbr0 Linux Bridge that uses as port the sole ethernet NIC available in my humble homelab server. And guess what? In my tests, when I open a SSH remote shell on the host, I see reported in the firewall log two packets dropped. Then I've seen the same happening when connecting the same way to any of my VMs, exactly two packets dropped while establishing the connection. The connections are made fast, you cannot tell anything visually in the client, but the firewall reports the drops. An interesting detail to add here is that the packets dropped when connecting to the Proxmox VE host seem to go through a PVEFW-HOST-IN firewall rule.
On the other hand, in my VMs I have running a Kubernetes cluster with two apps exposed with external IPs. One is the Traefik Dashboard and the other is a Nextcloud instance. This time what has happened is that I've been unable to connect to the Traefik Dashboard, like not at all, but I've reached Nextcloud. In this case I've seen a lot of packets being dropped in the attempt to connect to the Traefik Dashboard, but just one when reaching Nexcloud. Meanwhile, the cluster itself runs fine, I don't see any drops in the firewall log related to the internal networking between the Kubernetes nodes.
Then I disabled the firewall to see if that had any effect on the issue, but I still couldn't reach the Traefik Dashboard. I rebooted the server to see if Proxmox VE loading without the firewall could have any effect but apparently didn't because now I just couldn't reach neither Traefik nor Nextcloud, a thing I had already seen in previous tests.
So now I'm starting to think that maybe this is some odd kernel issue, or just a problem with some sysctl parameter. In regard of the second possibility I'll share below all the sysctl net related parameters I've customized in my Proxmox VE host. Of course, don't hesitate in pointing me out anything that I may have set wrong.
Bash:
## TCP/IP stack hardening

# Disable IPv6 protocol
net.ipv6.conf.all.disable_ipv6 = 1
net.ipv6.conf.default.disable_ipv6 = 1

# Timeout broken connections faster (amount of time to wait for FIN).
# Sets how many seconds to wait for a final FIN packet before the socket
# is forcibly closed. This is strictly a violation of the TCP specification,
# but required to prevent denial-of-service attacks.
# https://sysctl-explorer.net/net/ipv4/tcp_fin_timeout/
# Value in SECONDS.
net.ipv4.tcp_fin_timeout = 10

# IP loose spoofing protection or source route verification.
# Complements the rule set in /usr/lib/sysctl.d/pve-firewall.conf for all interfaces.
# Set to "loose" (2) to avoid unexpected networking problems in usual scenarios.
net.ipv4.conf.default.rp_filter = 2

# Ignore ICMP broadcast requests to avoid being affected by Smurf attacks.
net.ipv4.icmp_echo_ignore_broadcasts = 1

# Ignore ICMP echo requests, or pings.
# Commented by default since Proxmox VE or any other monitoring tool might
# need to do pings to this host.
# Uncomment only if you're sure that your system won't need to respond to pings.
# net.ipv4.icmp_echo_ignore_all = 1
# net.ipv6.icmp.echo_ignore_all = 1

# Ignore ICMP bogus responses to broadcast frames.
# This avoids cluttering the log with warnings about those responses.
net.ipv4.icmp_ignore_bogus_error_responses = 1

# Protect against tcp time-wait assassination hazards,
# drop RST packets for sockets in the time-wait state.
net.ipv4.tcp_rfc1337 = 1

# Disable source packet routing; this system is not a router.
net.ipv4.conf.all.accept_source_route = 0
net.ipv4.conf.default.accept_source_route = 0
net.ipv6.conf.all.accept_source_route = 0
net.ipv6.conf.default.accept_source_route = 0

# Ignore send redirects; this system is not a router.
net.ipv4.conf.all.send_redirects = 0
net.ipv4.conf.default.send_redirects = 0

# Do not accept ICMP redirects; prevents MITM attacks.
net.ipv4.conf.all.accept_redirects = 0
net.ipv4.conf.default.accept_redirects = 0
net.ipv4.conf.all.secure_redirects = 0
net.ipv4.conf.default.secure_redirects = 0
net.ipv6.conf.all.accept_redirects = 0
net.ipv6.conf.default.accept_redirects = 0

# Protection from SYN flood attack.
net.ipv4.tcp_syncookies = 1
# Only retry creating TCP connections twice.
# Minimize the time it takes for a connection attempt to fail.
net.ipv4.tcp_syn_retries = 2
net.ipv4.tcp_synack_retries = 2
net.ipv4.tcp_orphan_retries = 2

# For intranets or low latency users, SACK is not worth it.
# Also can become a performance and security issue.
net.ipv4.tcp_sack = 0

# A martian packet is an IP packet which specifies a source or destination
# address that is reserved for special-use by Internet Assigned Numbers Authority
# (IANA).
# To monitor 'martian' packets in your logs, enable the lines below.
# Be aware that this can fill up your logs with a lot of information,
# so use these options only if you really need to do some checking or diagnostics.
# net.ipv4.conf.all.log_martians = 1
# net.ipv4.conf.default.log_martians = 1

# A help mitigating the potential problem of "dropping packets" provoked by a DoS
# attack or intense network activitiy.
# Size of connection tracking table. Default value is nf_conntrack_buckets value * 4.
# The nf_conntrack_buckets parameter is the size of hash table.
# The conntrack_max parameters are simply a ratio to the size of RAM on the node.
# https://www.kernel.org/doc/html/latest/networking/nf_conntrack-sysctl.html
net.netfilter.nf_conntrack_max = 1048576
net.nf_conntrack_max = 1048576

## NETWORK optimizations

# TCP Fast Open is an extension to the transmission control protocol (TCP)
# that helps reduce network latency by enabling data to be exchanged during
# the sender’s initial TCP SYN [3]. Using the value 3 instead of the default 1
# allows TCP Fast Open for both incoming and outgoing connections.
net.ipv4.tcp_fastopen = 3

# Wait a maximum of 5 * 2 = 10 seconds in the TIME_WAIT state after a FIN,
# to handle any remaining packets in the network.
# Load module nf_conntrack if needed.
# Value is an INTEGER.
net.netfilter.nf_conntrack_tcp_timeout_fin_wait = 5

# Keepalive optimizations
#
# TCP keepalive is a mechanism for TCP connections that help to determine whether
# the other end has stopped responding or not. TCP will send the keepalive probe
# that contains null data to the network peer several times after a period of idle
# time. If the peer does not respond, the socket will be closed automatically.
#
# By default, the keepalive routines wait for two hours (7200 secs)
# before sending the first keepalive probe, and then resend it every 75 seconds.
# If no ACK response is received for 9 consecutive times, the connection
# is marked as broken. As long as there is TCP/IP socket communications going on
# and active, no keepalive packets are needed.
#
# The default values are:
# tcp_keepalive_time = 7200, tcp_keepalive_intvl = 75, tcp_keepalive_probes = 9
#
# We would decrease the default values for tcp_keepalive_* params as follow:
#
# Disconnect dead TCP connections after 10 minutes
# https://sysctl-explorer.net/net/ipv4/tcp_keepalive_time/
# Value in SECONDS.
net.ipv4.tcp_keepalive_time = 60
#
# Determines the wait time between isAlive interval probes (reduce from 75 sec to 15).
# https://sysctl-explorer.net/net/ipv4/tcp_keepalive_intvl/
# Value in SECONDS.
net.ipv4.tcp_keepalive_intvl = 10
#
# Determines the number of probes before timing out (reduce from 9 sec to 5 sec).
# https://sysctl-explorer.net/net/ipv4/tcp_keepalive_probes/
# Value in SECONDS.
net.ipv4.tcp_keepalive_probes = 6

# The longer the maximum transmission unit (MTU) the better for performance,
# but the worse for reliability. This is because a lost packet means more data
# to be retransmitted and because many routers on the Internet cannot deliver
# very long packets.
net.ipv4.tcp_mtu_probing = 1

# Maximum number of connections that can be queued for acceptance.
net.core.somaxconn = 256000

# How many half-open connections for which the client has not yet
# sent an ACK response can be kept in the queue or, in other words,
# the maximum queue length of pending connections 'Waiting Acknowledgment'.
# SYN cookies only kick in when this number of remembered connections is surpassed.
# Handle SYN floods and large numbers of valid HTTPS connections.
net.ipv4.tcp_max_syn_backlog = 40000

# Maximal number of packets in the receive queue that passed through the network
# interface and are waiting to be processed by the kernel.
# Increase the length of the network device input queue.
net.core.netdev_max_backlog = 50000

# Huge improve Linux network performance by change TCP congestion control to BBR
# (Bottleneck Bandwidth and RTT).
# BBR congestion control computes the sending rate based on the delivery
# rate (throughput) estimated from ACKs.
# https://djangocas.dev/blog/huge-improve-network-performance-by-change-tcp-congestion-control-to-bbr/
net.core.default_qdisc = fq
net.ipv4.tcp_congestion_control = bbr

# Increase ephemeral IP ports available for outgoing connections.
# The ephemeral port is typically used by the Transmission Control Protocol (TCP),
# User Datagram Protocol (UDP), or the Stream Control Transmission Protocol (SCTP)
# as the port assignment for the client end of a client–server communication.
# https://www.cyberciti.biz/tips/linux-increase-outgoing-network-sockets-range.html
net.ipv4.ip_local_port_range = 30000 65535

# This is a setting for large networks (more than 128 hosts), and this includes
# having many virtual machines or containers running in the Proxmox VE platform.
# https://www.serveradminblog.com/2011/02/neighbour-table-overflow-sysctl-conf-tunning/
net.ipv4.neigh.default.gc_thresh1 = 1024
net.ipv4.neigh.default.gc_thresh2 = 4096
# The gc_thresh3 is already set at /usr/lib/sysctl.d/10-pve-ct-inotify-limits.conf

# Limits number of Challenge ACK sent per second, as recommended in RFC 5961.
# Improves TCP’s Robustness to Blind In-Window Attacks.
# https://sysctl-explorer.net/net/ipv4/tcp_challenge_ack_limit/
net.ipv4.tcp_challenge_ack_limit = 9999

# Sets whether TCP should start at the default window size only for new connections
# or also for existing connections that have been idle for too long.
# This setting kills persistent single connection performance and could be turned off.
# https://sysctl-explorer.net/net/ipv4/tcp_slow_start_after_idle/
# https://github.com/ton31337/tools/wiki/tcp_slow_start_after_idle---tcp_no_metrics_save-performance
net.ipv4.tcp_slow_start_after_idle = 0

# Maximal number of sockets in TIME_WAIT state held by the system simultaneously.
# After reaching this number, the system will start destroying the sockets
# that are in this state. Increase this number to prevent simple DOS attacks.
# https://sysctl-explorer.net/net/ipv4/tcp_max_tw_buckets/
net.ipv4.tcp_max_tw_buckets = 500000

# Sets whether TCP should reuse an existing connection in the TIME-WAIT state
# for a new outgoing connection, if the new timestamp is strictly bigger than
# the most recent timestamp recorded for the previous connection.
# This helps avoid from running out of available network sockets
# https://sysctl-explorer.net/net/ipv4/tcp_tw_reuse/
net.ipv4.tcp_tw_reuse = 1

# Increase Linux autotuning TCP buffer limits.
# The default the Linux network stack is not configured for high speed large
# file transfer across WAN links (i.e. handle more network packets) and setting
# the correct values may save memory resources.
# Values in BYTES.
net.core.rmem_default = 1048576
net.core.rmem_max = 16777216
net.core.wmem_default = 1048576
net.core.wmem_max = 16777216
net.core.optmem_max = 65536
net.ipv4.tcp_rmem = 4096 1048576 2097152
net.ipv4.tcp_wmem = 4096 65536 16777216

# In case UDP connections are used, these limits should also be raised.
# Values in BYTES.
# https://sysctl-explorer.net/net/ipv4/udp_rmem_min/
net.ipv4.udp_rmem_min = 8192
# https://sysctl-explorer.net/net/ipv4/udp_wmem_min/
net.ipv4.udp_wmem_min = 8192

# The maximum length of dgram socket receive queue.
net.unix.max_dgram_qlen = 1024
While I was copying the sysctl parameters above, I've checked the current real value of the sysctl parameters set in the /etc/sysctl.d/pve.conf file and I've found out that two of them don't correspond. I copy the pve.conf file below for reference.
The values net.bridge.bridge-nf-call-iptables and net.bridge.bridge-nf-call-ip6tables are shown by the sysctl command as set with value 1, instead of the 0 they should have. If I remember correctly, the parameter net.bridge.bridge-nf-call-iptables is controlled by the firewall somehow, so that could explain its value (when I checked it, I had the Proxmox firewall running). I set them manually as 0 with sysctl -w but didn't seem to have any effect on the issue.
That's all I've seen for now, and I'm running out of ideas to try.
This site uses cookies to help personalise content, tailor your experience and to keep you logged in if you register.
By continuing to use this site, you are consenting to our use of cookies.


")