*******************************
My Proxmox has been running wo. a hitch, since i installed 8.xx , about a year ago.
I had my first "Hang" today @06:36
Discovered by my inability to logon to the Proxmox web GUI.
The node was "unpingable" , and all VM's unreachable.
*******************************
Hardware :
HP Prodesk 600 G5 - Mini
00:1f.6 Ethernet controller: Intel Corporation Ethernet Connection (7) I219-LM (rev 10)
root@prox-01:~# lspci -nnk | grep -A2 Ethernet
00:1f.6 Ethernet controller [0200]: Intel Corporation Ethernet Connection (7) I219-LM [8086:15bb] (rev 10)
DeviceName: Onboard Lan
Subsystem: Hewlett-Packard Company Device [103c:8598]
root@prox-01:~#
*******************************
Virtual Environment 9.0.10, Fully udated this week.
root@prox-01:~# uname -a
Linux prox-01 6.14.11-2-pve #1 SMP PREEMPT_DYNAMIC PMX 6.14.11-2 (2025-09-12T09:46Z) x86_64 GNU/Linux
root@prox-01:~#
*******************************
I see several threads about Intel Ethernet hang's
Ie.
But my setup has been running without any issues at all, with 8.x.x ... For more than a year.
I updated to 9.x.x a few weeks ago , using the "pve-???-full" script to check & pass all requirements.
I was "short" pressing the "Power button" once, and the system did shutdown (I think nicely).
I suppose that Proxmox was runnng , but lost ethernet connectivity.
This is my first "hang", so i'm not sure if this is "bad luck" or a continuous issue
I'm mostly posting this as an info, and maybe to get some info about if the "old issues" are still present in 9.x.x or ??
Any hints/comments welcome
/Bingo
Ps:
And a big thank you to the Proxmox Team , for allowing us "home users" to use this great software.
My Proxmox has been running wo. a hitch, since i installed 8.xx , about a year ago.
I had my first "Hang" today @06:36
Discovered by my inability to logon to the Proxmox web GUI.
The node was "unpingable" , and all VM's unreachable.
*******************************
Hardware :
HP Prodesk 600 G5 - Mini
00:1f.6 Ethernet controller: Intel Corporation Ethernet Connection (7) I219-LM (rev 10)
root@prox-01:~# lspci -nnk | grep -A2 Ethernet
00:1f.6 Ethernet controller [0200]: Intel Corporation Ethernet Connection (7) I219-LM [8086:15bb] (rev 10)
DeviceName: Onboard Lan
Subsystem: Hewlett-Packard Company Device [103c:8598]
root@prox-01:~#
*******************************
Virtual Environment 9.0.10, Fully udated this week.
root@prox-01:~# uname -a
Linux prox-01 6.14.11-2-pve #1 SMP PREEMPT_DYNAMIC PMX 6.14.11-2 (2025-09-12T09:46Z) x86_64 GNU/Linux
root@prox-01:~#
*******************************
Code:
From syslog
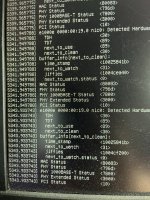
Seems to be ethernet related:
Keeps going ... Every 2 sec's , until i rebooted at around 07:00
Then the node was available again.
2025-09-27T04:17:01.544173+02:00 prox-01 CRON[3074537]: (root) CMD (cd / && run-parts --report /etc/cron.hourly)
2025-09-27T04:17:17.837374+02:00 prox-01 pvedaemon[3009417]: worker exit
2025-09-27T04:17:17.866566+02:00 prox-01 pvedaemon[1194]: worker 3009417 finished
2025-09-27T04:17:17.866648+02:00 prox-01 pvedaemon[1194]: starting 1 worker(s)
2025-09-27T04:17:17.866686+02:00 prox-01 pvedaemon[1194]: worker 3074628 started
2025-09-27T04:31:30.383861+02:00 prox-01 smartd[823]: Device: /dev/sda [SAT], SMART Usage Attribute: 190 Airflow_Temperature_Cel changed from 67 to 66
2025-09-27T04:38:46.103288+02:00 prox-01 pveproxy[3028385]: worker exit
2025-09-27T04:38:46.133956+02:00 prox-01 pveproxy[1204]: worker 3028385 finished
2025-09-27T04:38:46.134035+02:00 prox-01 pveproxy[1204]: starting 1 worker(s)
2025-09-27T04:38:46.136367+02:00 prox-01 pveproxy[1204]: worker 3079566 started
2025-09-27T05:01:30.396453+02:00 prox-01 smartd[823]: Device: /dev/sda [SAT], SMART Usage Attribute: 190 Airflow_Temperature_Cel changed from 66 to 65
2025-09-27T05:17:01.599008+02:00 prox-01 CRON[3088298]: (root) CMD (cd / && run-parts --report /etc/cron.hourly)
2025-09-27T05:18:58.651928+02:00 prox-01 pveproxy[3028384]: worker exit
2025-09-27T05:18:58.682159+02:00 prox-01 pveproxy[1204]: worker 3028384 finished
2025-09-27T05:18:58.682238+02:00 prox-01 pveproxy[1204]: starting 1 worker(s)
2025-09-27T05:18:58.684665+02:00 prox-01 pveproxy[1204]: worker 3088748 started
2025-09-27T05:22:46.911863+02:00 prox-01 pveproxy[1204]: worker 3028383 finished
2025-09-27T05:22:46.922290+02:00 prox-01 pveproxy[1204]: starting 1 worker(s)
2025-09-27T05:22:46.922334+02:00 prox-01 pveproxy[1204]: worker 3089609 started
2025-09-27T05:22:47.295014+02:00 prox-01 pveproxy[3089608]: got inotify poll request in wrong process - disabling inotify
2025-09-27T05:22:47.865747+02:00 prox-01 pveproxy[3089608]: worker exit
2025-09-27T05:31:30.408696+02:00 prox-01 smartd[823]: Device: /dev/sda [SAT], SMART Usage Attribute: 190 Airflow_Temperature_Cel changed from 65 to 67
2025-09-27T06:17:01.652618+02:00 prox-01 CRON[3101708]: (root) CMD (cd / && run-parts --report /etc/cron.hourly)
2025-09-27T06:25:01.679144+02:00 prox-01 CRON[3103605]: (root) CMD (test -x /usr/sbin/anacron || { cd / && run-parts --report /etc/cron.daily; })
2025-09-27T06:31:30.434443+02:00 prox-01 smartd[823]: Device: /dev/sda [SAT], SMART Usage Attribute: 190 Airflow_Temperature_Cel changed from 67 to 62
2025-09-27T06:32:46.672038+02:00 prox-01 pvedaemon[3035025]: worker exit
2025-09-27T06:32:46.701163+02:00 prox-01 pvedaemon[1194]: worker 3035025 finished
2025-09-27T06:32:46.701250+02:00 prox-01 pvedaemon[1194]: starting 1 worker(s)
2025-09-27T06:32:46.701284+02:00 prox-01 pvedaemon[1194]: worker 3105368 started
2025-09-27T06:34:36.839088+02:00 prox-01 kernel: e1000e 0000:00:1f.6 eno1: Detected Hardware Unit Hang:
2025-09-27T06:34:36.839114+02:00 prox-01 kernel: TDH <98>
2025-09-27T06:34:36.839117+02:00 prox-01 kernel: TDT <81>
2025-09-27T06:34:36.839119+02:00 prox-01 kernel: next_to_use <81>
2025-09-27T06:34:36.839120+02:00 prox-01 kernel: next_to_clean <97>
2025-09-27T06:34:36.839122+02:00 prox-01 kernel: buffer_info[next_to_clean]:
2025-09-27T06:34:36.839124+02:00 prox-01 kernel: time_stamp <130eaba7a>
2025-09-27T06:34:36.839125+02:00 prox-01 kernel: next_to_watch <98>
2025-09-27T06:34:36.839127+02:00 prox-01 kernel: jiffies <130eac301>
2025-09-27T06:34:36.839129+02:00 prox-01 kernel: next_to_watch.status <0>
2025-09-27T06:34:36.839130+02:00 prox-01 kernel: MAC Status <80083>
2025-09-27T06:34:36.839132+02:00 prox-01 kernel: PHY Status <796d>
2025-09-27T06:34:36.839133+02:00 prox-01 kernel: PHY 1000BASE-T Status <3800>
2025-09-27T06:34:36.839135+02:00 prox-01 kernel: PHY Extended Status <3000>
2025-09-27T06:34:36.839137+02:00 prox-01 kernel: PCI Status <10>
2025-09-27T06:34:38.886080+02:00 prox-01 kernel: e1000e 0000:00:1f.6 eno1: Detected Hardware Unit Hang:
2025-09-27T06:34:38.886098+02:00 prox-01 kernel: TDH <98>
2025-09-27T06:34:38.886100+02:00 prox-01 kernel: TDT <81>
2025-09-27T06:34:38.886101+02:00 prox-01 kernel: next_to_use <81>
2025-09-27T06:34:38.886121+02:00 prox-01 kernel: next_to_clean <97>
2025-09-27T06:34:38.886122+02:00 prox-01 kernel: buffer_info[next_to_clean]:
2025-09-27T06:34:38.886123+02:00 prox-01 kernel: time_stamp <130eaba7a>
2025-09-27T06:34:38.886198+02:00 prox-01 kernel: next_to_watch <98>
2025-09-27T06:34:38.886218+02:00 prox-01 kernel: jiffies <130eacb00>
2025-09-27T06:34:38.886219+02:00 prox-01 kernel: next_to_watch.status <0>
2025-09-27T06:34:38.886220+02:00 prox-01 kernel: MAC Status <80083>
2025-09-27T06:34:38.886221+02:00 prox-01 kernel: PHY Status <796d>
2025-09-27T06:34:38.886222+02:00 prox-01 kernel: PHY 1000BASE-T Status <3800>
2025-09-27T06:34:38.886223+02:00 prox-01 kernel: PHY Extended Status <3000>
2025-09-27T06:34:38.886224+02:00 prox-01 kernel: PCI Status <10>
2025-09-27T06:34:40.870135+02:00 prox-01 kernel: e1000e 0000:00:1f.6 eno1: Detected Hardware Unit Hang:
2025-09-27T06:34:40.870159+02:00 prox-01 kernel: TDH <98>
2025-09-27T06:34:40.870162+02:00 prox-01 kernel: TDT <81>
2025-09-27T06:34:40.870164+02:00 prox-01 kernel: next_to_use <81>
2025-09-27T06:34:40.870165+02:00 prox-01 kernel: next_to_clean <97>
2025-09-27T06:34:40.870167+02:00 prox-01 kernel: buffer_info[next_to_clean]:
2025-09-27T06:34:40.870168+02:00 prox-01 kernel: time_stamp <130eaba7a>
2025-09-27T06:34:40.870170+02:00 prox-01 kernel: next_to_watch <98>
2025-09-27T06:34:40.870172+02:00 prox-01 kernel: jiffies <130ead2c0>
2025-09-27T06:34:40.870173+02:00 prox-01 kernel: next_to_watch.status <0>
2025-09-27T06:34:40.870175+02:00 prox-01 kernel: MAC Status <80083>
2025-09-27T06:34:40.870176+02:00 prox-01 kernel: PHY Status <796d>
2025-09-27T06:34:40.870178+02:00 prox-01 kernel: PHY 1000BASE-T Status <3800>
2025-09-27T06:34:40.870179+02:00 prox-01 kernel: PHY Extended Status <3000>
2025-09-27T06:34:40.870181+02:00 prox-01 kernel: PCI Status <10>
Code:
*******************************

Hardware :
HP Prodesk 600 G5 - Mini

00:1f.6 Ethernet controller: Intel Corporation Ethernet Connection (7) I219-LM (rev 10)

root@prox-01:~# lspci -nnk | grep -A2 Ethernet
00:1f.6 Ethernet controller [0200]: Intel Corporation Ethernet Connection (7) I219-LM [8086:15bb] (rev 10)
    DeviceName: Onboard Lan
    Subsystem: Hewlett-Packard Company Device [103c:8598]
root@prox-01:~#

*******************************

Virtual Environment 9.0.10, Fully udated this week.

root@prox-01:~# uname -a
Linux prox-01 6.14.11-2-pve #1 SMP PREEMPT_DYNAMIC PMX 6.14.11-2 (2025-09-12T09:46Z) x86_64 GNU/Linux
root@prox-01:~#

*******************************


root@prox-01:~# ethtool -g eno1
Ring parameters for eno1:
Pre-set maximums:
RX:            4096
RX Mini:        n/a
RX Jumbo:        n/a
TX:            4096
TX push buff len:    n/a
Current hardware settings:
RX:            256
RX Mini:        n/a
RX Jumbo:        n/a
TX:            256
RX Buf Len:        n/a
CQE Size:        n/a
TX Push:        off
RX Push:        off
TX push buff len:    n/a
TCP data split:        n/a
root@prox-01:~#


root@prox-01:~# ip a
1: lo: <LOOPBACK,UP,LOWER_UP> mtu 65536 qdisc noqueue state UNKNOWN group default qlen 1000
    link/loopback 00:00:00:00:00:00 brd 00:00:00:00:00:00
    inet 127.0.0.1/8 scope host lo
       valid_lft forever preferred_lft forever
    inet6 ::1/128 scope host noprefixroute
       valid_lft forever preferred_lft forever
2: eno1: <BROADCAST,MULTICAST,UP,LOWER_UP> mtu 1500 qdisc fq_codel master vmbr0 state UP group default qlen 1000
    link/ether e8:d8:d1:xx:yy:zz brd ff:ff:ff:ff:ff:ff
    altname enp0s31f6
    altname enxe8d8d1578062
3: wlp0s20f3: <BROADCAST,MULTICAST> mtu 1500 qdisc noop state DOWN group default qlen 1000
    link/ether 80:32:53:4d:76:d7 brd ff:ff:ff:ff:ff:ff
    altname wlx8032534d76d7
4: vmbr0: <BROADCAST,MULTICAST,UP,LOWER_UP> mtu 1500 qdisc noqueue state UP group default qlen 1000
    link/ether e8:d8:d1:xx:yy:zz brd ff:ff:ff:ff:ff:ff
    inet6 fe80::ead8:d1ff:fe57:8062/64 scope link proto kernel_ll
       valid_lft forever preferred_lft forever
5: vmbr0.100@vmbr0: <BROADCAST,MULTICAST,UP,LOWER_UP> mtu 1500 qdisc noqueue state UP group default qlen 1000
    link/ether e8:d8:d1:xx:yy:zz brd ff:ff:ff:ff:ff:ff
    inet 192.168.xx.yy/24 scope global vmbr0.100
       valid_lft forever preferred_lft forever
    inet6 fe80::ead8:d1ff:fe57:8062/64 scope link proto kernel_ll
       valid_lft forever preferred_lft forever
6: tap103i0: <BROADCAST,MULTICAST,PROMISC,UP,LOWER_UP> mtu 1500 qdisc fq_codel master fwbr103i0 state UNKNOWN group default qlen 1000
    link/ether 56:49:d7:d6:8a:db brd ff:ff:ff:ff:ff:ff
7: fwbr103i0: <BROADCAST,MULTICAST,UP,LOWER_UP> mtu 1500 qdisc noqueue state UP group default qlen 1000
    link/ether 12:de:82:b7:dd:30 brd ff:ff:ff:ff:ff:ff
8: fwpr103p0@fwln103i0: <BROADCAST,MULTICAST,UP,LOWER_UP> mtu 1500 qdisc noqueue master vmbr0 state UP group default qlen 1000
    link/ether ca:bf:58:5e:53:a9 brd ff:ff:ff:ff:ff:ff
9: fwln103i0@fwpr103p0: <BROADCAST,MULTICAST,UP,LOWER_UP> mtu 1500 qdisc noqueue master fwbr103i0 state UP group default qlen 1000
    link/ether 12:de:82:b7:dd:30 brd ff:ff:ff:ff:ff:ff
10: tap102i0: <BROADCAST,MULTICAST,PROMISC,UP,LOWER_UP> mtu 1500 qdisc fq_codel master vmbr0 state UNKNOWN group default qlen 1000
    link/ether 5e:12:be:15:fa:72 brd ff:ff:ff:ff:ff:ff
11: tap100i0: <BROADCAST,MULTICAST,PROMISC,UP,LOWER_UP> mtu 1500 qdisc fq_codel master fwbr100i0 state UNKNOWN group default qlen 1000
    link/ether de:63:dd:cd:e8:55 brd ff:ff:ff:ff:ff:ff
12: fwbr100i0: <BROADCAST,MULTICAST,UP,LOWER_UP> mtu 1500 qdisc noqueue state UP group default qlen 1000
    link/ether 6e:8e:93:df:06:99 brd ff:ff:ff:ff:ff:ff
13: fwpr100p0@fwln100i0: <BROADCAST,MULTICAST,UP,LOWER_UP> mtu 1500 qdisc noqueue master vmbr0 state UP group default qlen 1000
    link/ether 6a:9b:71:0c:5e:3e brd ff:ff:ff:ff:ff:ff
14: fwln100i0@fwpr100p0: <BROADCAST,MULTICAST,UP,LOWER_UP> mtu 1500 qdisc noqueue master fwbr100i0 state UP group default qlen 1000
    link/ether 6e:8e:93:df:06:99 brd ff:ff:ff:ff:ff:ff
15: tap104i0: <BROADCAST,MULTICAST,PROMISC,UP,LOWER_UP> mtu 1500 qdisc fq_codel master vmbr0 state UNKNOWN group default qlen 1000
    link/ether b6:cc:89:b8:77:d7 brd ff:ff:ff:ff:ff:ff
16: tap105i0: <BROADCAST,MULTICAST,PROMISC,UP,LOWER_UP> mtu 1500 qdisc fq_codel master vmbr0 state UNKNOWN group default qlen 1000
    link/ether 9a:b2:f3:d2:c6:63 brd ff:ff:ff:ff:ff:ff
17: tap106i0: <BROADCAST,MULTICAST,PROMISC,UP,LOWER_UP> mtu 1500 qdisc fq_codel master fwbr106i0 state UNKNOWN group default qlen 1000
    link/ether 02:78:8d:a3:63:08 brd ff:ff:ff:ff:ff:ff
18: fwbr106i0: <BROADCAST,MULTICAST,UP,LOWER_UP> mtu 1500 qdisc noqueue state UP group default qlen 1000
    link/ether da:d2:ff:0e:50:fc brd ff:ff:ff:ff:ff:ff
19: fwpr106p0@fwln106i0: <BROADCAST,MULTICAST,UP,LOWER_UP> mtu 1500 qdisc noqueue master vmbr0 state UP group default qlen 1000
    link/ether 76:bf:db:a7:39:8a brd ff:ff:ff:ff:ff:ff
20: fwln106i0@fwpr106p0: <BROADCAST,MULTICAST,UP,LOWER_UP> mtu 1500 qdisc noqueue master fwbr106i0 state UP group default qlen 1000
    link/ether da:d2:ff:0e:50:fc brd ff:ff:ff:ff:ff:ff
21: tap107i0: <BROADCAST,MULTICAST,PROMISC,UP,LOWER_UP> mtu 1500 qdisc fq_codel master fwbr107i0 state UNKNOWN group default qlen 1000
    link/ether 9e:6a:25:5e:3f:5b brd ff:ff:ff:ff:ff:ff
22: fwbr107i0: <BROADCAST,MULTICAST,UP,LOWER_UP> mtu 1500 qdisc noqueue state UP group default qlen 1000
    link/ether 0e:1b:00:a7:f9:84 brd ff:ff:ff:ff:ff:ff
23: fwpr107p0@fwln107i0: <BROADCAST,MULTICAST,UP,LOWER_UP> mtu 1500 qdisc noqueue master vmbr0 state UP group default qlen 1000
    link/ether ca:6f:8d:c9:58:8b brd ff:ff:ff:ff:ff:ff
24: fwln107i0@fwpr107p0: <BROADCAST,MULTICAST,UP,LOWER_UP> mtu 1500 qdisc noqueue master fwbr107i0 state UP group default qlen 1000
    link/ether 0e:1b:00:a7:f9:84 brd ff:ff:ff:ff:ff:ff
root@prox-01:~#
I see several threads about Intel Ethernet hang's
Ie.
Hello,
i am using Proxmox on an Intel NUC NUC8i3BEH2.
Actually it is running quite stable for a long time, but recently there is some more persistent network throuput (5-10 mb/s for several hours) on an Qemu vm and I get the following message from time to time "Detected Hardware Unit Hang" (see dmesg output). When I reboot the system it works for maybe 1-2 hours and than (after the persistent network throughput) I got the message again. I also tried
I got some lxc containers which are connected directly with bridge...
i am using Proxmox on an Intel NUC NUC8i3BEH2.
Actually it is running quite stable for a long time, but recently there is some more persistent network throuput (5-10 mb/s for several hours) on an Qemu vm and I get the following message from time to time "Detected Hardware Unit Hang" (see dmesg output). When I reboot the system it works for maybe 1-2 hours and than (after the persistent network throughput) I got the message again. I also tried
ethtool -K eno1 tso off gso off but the hang still appears.I got some lxc containers which are connected directly with bridge...
- bogo22
- Replies: 116
- Forum: Proxmox VE: Installation and configuration

But my setup has been running without any issues at all, with 8.x.x ... For more than a year.
I updated to 9.x.x a few weeks ago , using the "pve-???-full" script to check & pass all requirements.
I was "short" pressing the "Power button" once, and the system did shutdown (I think nicely).
I suppose that Proxmox was runnng , but lost ethernet connectivity.
This is my first "hang", so i'm not sure if this is "bad luck" or a continuous issue
I'm mostly posting this as an info, and maybe to get some info about if the "old issues" are still present in 9.x.x or ??
Any hints/comments welcome
/Bingo
Ps:
And a big thank you to the Proxmox Team , for allowing us "home users" to use this great software.
Last edited: