[SOLVED] how to troubleshoot dropped packets

Mar 8, 2022
49
9
13
37
I recently reinstalled netdata and have been receiving notifications like this:
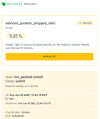


1654648432841.png

Output of ip -s link show vmbr0


Code:
20: vmbr0: <BROADCAST,MULTICAST,UP,LOWER_UP> mtu 1500 qdisc noqueue state UP mode DEFAULT group default qlen 1000
    link/ether fc:34:97:a1:31:7d brd ff:ff:ff:ff:ff:ff
    RX: bytes  packets  errors  dropped missed  mcast
    3881705530 12322876 0       491986  0       101866
    TX: bytes  packets  errors  dropped carrier collsns
    171668466551 13828385 0       0       0       0


Addition info if it helps at all:

/etc/network/interfaces

Code:
auto lo
iface lo inet loopback

iface eno1 inet manual

auto vmbr0
iface vmbr0 inet static
        address 192.168.1.125/24
        gateway 192.168.1.1
        bridge-ports eno1
        bridge-stp off
        bridge-fd 0

load average: 1.21, 1.29, 1.36

1 NIC. No HP switches. I have a TP-Link TL-SG108PE V3 and a NETGEAR GS308 on my network.

I have a constant ping to the Proxmox host IP, a VM IP on PM and out to google all from a pc on the network. I notice the Proxmox host IP and VM IP time out for 3 pings at the same exact time... ping to google is fine. At this same time my Plex direct streams on one of the VMs will stop to buffer as well.

What steps to I take to begin troubleshooting this?
 
Last edited:
Hi,

looks like a hard problem to me :). It could be that your Proxmox server is so busy that it is dropping packets which would also stop the VMs on it from getting them. It could also be that there is some defective hardware.

I would first try to figure out if there is maybe some issue with high system load at the times when the packets get dropped.
 
Code:
[ 1979.225665] e1000e 0000:00:1f.6 eno1: Detected Hardware Unit Hang:
                 TDH                  <1c>
                 TDT                  <be>
                 next_to_use          <be>
                 next_to_clean        <1b>
               buffer_info[next_to_clean]:
                 time_stamp           <100065d31>
                 next_to_watch        <1c>
                 jiffies              <100066760>
                 next_to_watch.status <0>
               MAC Status             <40080083>
               PHY Status             <796d>
               PHY 1000BASE-T Status  <3800>
               PHY Extended Status    <3000>
               PCI Status             <10>
[ 1979.353382] e1000e 0000:00:1f.6 eno1: Reset adapter unexpectedly
[ 1979.443144] vmbr0: port 1(eno1) entered disabled state
[ 1983.132165] e1000e 0000:00:1f.6 eno1: NIC Link is Up 1000 Mbps Full Duplex, Flow Control: None
[ 1983.132225] vmbr0: port 1(eno1) entered blocking state
[ 1983.132228] vmbr0: port 1(eno1) entered forwarding state

Just noticed this in the logs. Likely related. Coincides with the outages. Not sure what would cause this.

Using onboard NIC.

Code:
Base Board Information
        Manufacturer: ASUSTeK COMPUTER INC.
        Product Name: PRIME Z590-V
        Version: Rev 1.xx

00:1f.6 Ethernet controller: Intel Corporation Ethernet Connection (14) I219-V (rev 11)

Code:
Linux 5.15.35-1-pve #1 SMP PVE 5.15.35-3
 
Last edited:
Disabling only tso as several others have recommend seemed to do the trick! Thank you!

Code:
ethtool -K eno1 tso off

Added to /etc/network/interfaces as well. Have not tested to see if it survives a reboot yet.
 
  • Like
Reactions: shrdlicka
Having same problem - testing fix - will report back in 48h.
Did not fix the problem.

```
net_packets.vmbr0CHART​
inbound packets dropped ratio = 0.17%
the ratio of inbound dropped packets vs the total number of received packets of the network interface, during the last 10 minutesALARM​
vmbr0FAMILY
 
I am having the same or a related problem, but my dmesg is empty, no errors about hangs or anything else. I narrowed it down to the following.

Each PVE Node has a dedicated network card which is used only for Link 0 in the cluster. They are connected to a simple gigabit switch which only connects to other PVE nodes in the same cluster. So only PVE is "talking" on this network.
There is one packed dropped every 30 seconds. This happens on multiple machines, but not on all of them.

Here are two machines
View attachment 52652
and the other for the same timeframe
View attachment 52653

Since they both have the drop at the same time, I am guessing that some kind of broadcast is happening in the network. But what/which node causes it? Any ideas how to diagnose this?

I don't really care about single packet drops, but on the other interfaces I have a lot of dops (and also a lot of traffic which makes the diagnose more difficult)
 
Sorry, it's an old thread, but I came across the same issue. vmbr0 dropping packets like there's no tomorrow

Reviewed this https://blog.hambier.lu/post/tracking-dropped-packets
Turns out I had 2 devices sending out unknown packets -- identified using tcpdump

7679
7374
7a7a
7380

Blocked them using ebtables
Problem now gone.
I'll look back in tomorrow and see if it's fixed for good.

Was my SkyQ boxes.
 
Last edited:
Hi.
did you manage to fix it?

i'm stuck with a lot of dropped packages.


Sorry, it's an old thread, but I came across the same issue. vmbr0 dropping packets like there's no tomorrow

Reviewed this https://blog.hambier.lu/post/tracking-dropped-packets
Turns out I had 2 devices sending out unknown packets -- identified using tcpdump

7679
7374
7a7a
7380

Blocked them using ebtables
Problem now gone.
I'll look back in tomorrow and see if it's fixed for good.

Was my SkyQ boxes.
 
That was on my old server, and I've updated since

https://blog.hambier.lu/post/tracking-dropped-packets - I used Wireshark to identify the ports, then tcpdump to confirm the ports. Then issued the following

sudo tcpdump -v -i vmbr0 ether proto 0x7579
sudo tcpdump -v -i vmbr0 ether proto 0x7374
sudo tcpdump -v -i vmbr0 ether proto 0x7a7a
sudo tcpdump -v -i vmbr0 ether proto 0x7380

sudo ebtables -A INPUT -p 7579 -j DROP
sudo ebtables -A INPUT -p 7374 -j DROP
sudo ebtables -A INPUT -p 7a7a -j DROP
sudo ebtables -A INPUT -p 7380 -j DROP

to drop them. To be honest I hadn't checked on my new server yet whether I need to do this on there, I've been busy with other things. Yes I need to complete those steps again. I'll fire up the sky boxes later and update tomorrow. I need to check that they are the ports I need to block this time, though they probably are.

Then, from memory

sudo apt install netfilter-persistent
EBT=/usr/share/netfilter-persistent/plugins.d/35-ebtables
sudo wget -O $EBT https://git.zeyel.net/snippets/30/raw?inline=false
sudo chmod +x $EBT
sudo $EBT save

HTH
 
Last edited:
That was on my old server, and I've updated since

https://blog.hambier.lu/post/tracking-dropped-packets - I used Wireshark to identify the ports, then tcpdump to confirm the ports. Then issued the following

sudo tcpdump -v -i vmbr0 ether proto 0x7579
sudo tcpdump -v -i vmbr0 ether proto 0x7374
sudo tcpdump -v -i vmbr0 ether proto 0x7a7a
sudo tcpdump -v -i vmbr0 ether proto 0x7380

sudo ebtables -A INPUT -p 7579 -j DROP
sudo ebtables -A INPUT -p 7374 -j DROP
sudo ebtables -A INPUT -p 7a7a -j DROP
sudo ebtables -A INPUT -p 7380 -j DROP

to drop them. To be honest I hadn't checked on my new server yet whether I need to do this on there, I've been busy with other things. Yes I need to complete those steps again. I'll fire up the sky boxes later and update tomorrow. I need to check that they are the ports I need to block this time, though they probably are.

Then, from memory

sudo apt install netfilter-persistent
EBT=/usr/share/netfilter-persistent/plugins.d/35-ebtables
sudo wget -O $EBT https://git.zeyel.net/snippets/30/raw?inline=false
sudo chmod +x $EBT
sudo $EBT save

HTH

Are you sure you don’t have any drops?
 
Are you sure you don’t have any drops?
I know I have drops. I just need to start my sky boxes and other IOT devices to identify them. It's a busy time of year, so haven't had time to revisit and reapply. You'll know when it stops the mumber of drops with

ifconfig vmbr0

will stop increasing.
 
Hi,

It's very strange as i know my network conf is correct and lacp + vlan its working but in the netdata monitor i have alarm always System network interface vmbr0 inbound drops and it's not less. I checked my another proxmox host which is not configured vlan and lacp it has too ...

Strangely; It seems like everything working fine ...


auto lo
iface lo inet loopback

auto eno1
iface eno1 inet manual

auto eno2
iface eno2 inet manual

auto eno3
iface eno3 inet manual

auto eno4
iface eno4 inet manual

auto bond0
iface bond0 inet manual
bond-slaves eno1 eno2 eno3 eno4
bond-miimon 100
bond-mode 802.3ad
bond-xmit-hash-policy layer2+3

auto vmbr0
iface vmbr0 inet static
address xxx.xx.x.xx/24
gateway xxx.xx.x.x
bridge-ports bond0
bridge-stp off
bridge-fd 0
bridge-vlan-aware yes
bridge-vids 2-4094
 

About

The Proxmox community has been around for many years and offers help and support for Proxmox VE, Proxmox Backup Server, and Proxmox Mail Gateway.
We think our community is one of the best thanks to people like you!

Get your subscription!

The Proxmox team works very hard to make sure you are running the best software and getting stable updates and security enhancements, as well as quick enterprise support. Tens of thousands of happy customers have a Proxmox subscription. Get yours easily in our online shop.

Buy now!