[SOLVED] How to monitor Proxmox Backup Server

Hi,
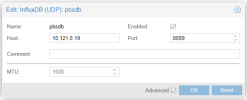
you can add an InfluxDB as a metric server by going to "Configuration" in the sidebar and switching to the tab "Metric Server".
 
Ah sorry, missed part of the question.
Could you access the InfluxDB's dashboard and lookup if it got any datapoints, so we can determine if the problem is between PBS and Influx or Influx and Grafana.
 
I cannot access influxdb dashboard.
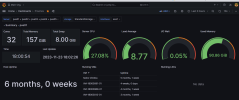
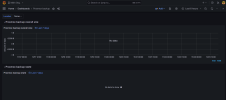
Here capture from grafana for PVE and PBS dashboard. PVE show graph and PBS cannot show.
I don't know, can them use 1 single database influxdb?
 

Attachments

  • pveinfluxdb.png
    pveinfluxdb.png
    191.1 KB · Views: 133
  • pbsinflux2.png
    pbsinflux2.png
    81 KB · Views: 114
It should be no problem to use the same database for both, except some stats from pbs might show up on the pve dashboard and the other way around. This could be circumvented by filtering for the host.

What query are you using to get the total backup size?
 
Last edited:
I meant the actual query, just so we can rule that out.

I would guess that you are on influxdb 1.x, since you are using the udp interface. That would also explain why you can't use the dashboard.
Could you use the influx cli tool to run show series and check if there is anything that looks like blockstat,datastore=xxxx,host=yyy,object=host.
You can launch the cli with influx -database <yourdb>
 
You can use the execute flag and pipe the result in grep:
Bash:
influx -database yourdb -execute "show series" | grep "blockstat,datastore"
 
That would mean that there are at least some records present. Just a hunch, but could you see if journalctl -efu influxdb gives you any errors, especially time outside range would be something I'd look for
 
Okay, there are no apparent errors in the logs.
Could you make sure that the hosts can reach each other, ie. by running ping?
If that works, I would check if there are actually udp packages arriving at the monitoring server. For that, could you please install tshark from the official repos. This can be simply done by running sudo apt install tshark.
Then run the following command:
Bash:
tshark -f "udp port 8089 && host 192.168.23.34" -c 10
#                                ^-----------^
#                   Replace this with the ip of your pbs host

This should collect 10 packages and then quit. If you see nothing for a while (>20 secs) you might need to check your pbs and network settings again and make sure that there is no firewall or similar in between that is filtering the traffic out.

If you get something similar to this:
Code:
    1 0.000000000 192.168.23.34 ? 192.168.23.36 UDP 1023 42945 ? 8089 Len=981
    2 10.001165586 192.168.23.34 ? 192.168.23.36 UDP 1023 39081 ? 8089 Len=981
    3 20.001727453 192.168.23.34 ? 192.168.23.36 UDP 1025 42951 ? 8089 Len=983
    4 30.003072976 192.168.23.34 ? 192.168.23.36 UDP 1025 37223 ? 8089 Len=983
    5 40.003982413 192.168.23.34 ? 192.168.23.36 UDP 1025 48886 ? 8089 Len=983
    6 50.005172428 192.168.23.34 ? 192.168.23.36 UDP 1025 47182 ? 8089 Len=983
    7 60.006711907 192.168.23.34 ? 192.168.23.36 UDP 1025 50512 ? 8089 Len=983
    8 70.600368480 192.168.23.34 ? 192.168.23.36 UDP 1024 58744 ? 8089 Len=982
    9 80.601702161 192.168.23.34 ? 192.168.23.36 UDP 1023 50970 ? 8089 Len=981
   10 90.602976383 192.168.23.34 ? 192.168.23.36 UDP 1025 46480 ? 8089 Len=983
I would ask you again, what query you are using on the grafana side to query the data.
 
Currently already show the graph of PBS at PVE dashboard. Do you have recommendation grafana dashboard for PBS, i think the PBS dashboard that i set for grafana not work. Or may be have tutorial for step by step for set the graph.

Here the result from wireshark dump
[root@Monitoring:/home/ubuntu# tshark -f "udp port 8089 && host 10.121.0.15" -i eth1 -c 10
Running as user "root" and group "root". This could be dangerous.
Capturing on 'eth1'
** (tshark:10318) 11:29:14.491099 [Main MESSAGE] -- Capture started.
** (tshark:10318) 11:29:14.491427 [Main MESSAGE] -- File: "/tmp/wireshark_eth1CWA7E2.pcapng"
1 0.000000000 10.121.0.15 → 10.121.0.19 UDP 1390 59271 → 8089 Len=1348
2 0.000000903 10.121.0.15 → 10.121.0.19 UDP 529 59271 → 8089 Len=487
3 10.000679252 10.121.0.15 → 10.121.0.19 UDP 1403 38580 → 8089 Len=1361
4 10.000679864 10.121.0.15 → 10.121.0.19 UDP 529 38580 → 8089 Len=487
5 20.001583954 10.121.0.15 → 10.121.0.19 UDP 1403 60031 → 8089 Len=1361
6 20.001584367 10.121.0.15 → 10.121.0.19 UDP 529 60031 → 8089 Len=487
7 30.002818078 10.121.0.15 → 10.121.0.19 UDP 1403 42679 → 8089 Len=1361
8 30.002819108 10.121.0.15 → 10.121.0.19 UDP 529 42679 → 8089 Len=487
9 40.003748952 10.121.0.15 → 10.121.0.19 UDP 1401 34613 → 8089 Len=1359
10 40.003749515 10.121.0.15 → 10.121.0.19 UDP 529 34613 → 8089 Len=487
10 packets captured]
 
Last edited:

About

The Proxmox community has been around for many years and offers help and support for Proxmox VE, Proxmox Backup Server, and Proxmox Mail Gateway.
We think our community is one of the best thanks to people like you!

Get your subscription!

The Proxmox team works very hard to make sure you are running the best software and getting stable updates and security enhancements, as well as quick enterprise support. Tens of thousands of happy customers have a Proxmox subscription. Get yours easily in our online shop.

Buy now!