High memory usage

elvinmammadov

Member
Feb 12, 2021
30
1
13
34
Hello,

We are have two Dell Servers and they are running Proxmox v7.2 with replication. The both server has 64Gb RAM. But the memory usage is high. Could you please let me know if it is normal for the Replication in Proxmox? If yes, why it shows high memory usage? Thanks.

Server A
RAM usage
94.82% (59.41 GiB of 62.65 GiB)
VM 1 - 24GB RAM
VM 2 - 2GB RAM

Server B
RAM usage
94.78% (59.38 GiB of 62.65 GiB)
VM 3 - 24GB RAM
VM 4 - 2GB RAM
VM 5 - 4GB RAM
VM 6 - 4GB RAM

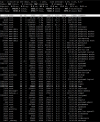
The result of TOP for the Server A
1688140594287.png

The result of TOP for the Server B
1688140629524.png
 
Last edited:
VM memory usage looks normal and no other process that use a lot. Maybe ZFS?
EDIT: Although we can't be sure because top is not sorted by memory (RES)...
 
Last edited:
He talked about using replication. So yes, sounds like ZFS and then by default UP TO 50% of the hot RAM will be used by the ARC for ZFS read caching (which won't be listed as "cache/buff" as the ARC is userspace, so listed as normal "used"). Run arc_summary to see how much RAM the ARC is min, max and actually using.
 
He talked about using replication. So yes, sounds like ZFS and then by default UP TO 50% of the hot RAM will be used by the ARC for ZFS read caching (which won't be listed as "cache/buff" as the ARC is userspace, so listed as normal "used"). Run arc_summary to see how much RAM the ARC is min, max and actually using.
Good catch! And thank you for explaining it in detail. Let's be happy that this very common question can be easily answered and fixed using the manual again.
 
Last edited:
Maybe, if we answer the same question often enough, ChatGPT will learn it and can replace our "jobs". ;)

Right now it is still failing to ask for ZFS:
Why is the RAM of my Proxmox VE server alway full?

There could be several reasons why the RAM of your Proxmox VE server is always full. One possible reason is that the virtual machines (VMs) running on the server are using up all available resources. Another reason could be that the Proxmox VE software itself is consuming a lot of memory. Additionally, if you have other services or applications running on the server, they could be using up memory as well. It is recommended to monitor the resource usage of all applications running on the server, including VMs, and adjust the allocation of resources accordingly or upgrade the server's hardware if necessary.
 
Maybe, if we answer the same question often enough, ChatGPT will learn it and can replace our "jobs". ;)
My experience is that you either coach ChatGPT to a most impressive answer or you trick it into spewing nonsense. Either way you need to know most of the answer beforehand.

I know some of us are answering the same questions over and over again, but I guess we are the memory of this forum and (mostly) new people don't know what to search for or which symptoms are relevant. But it does get a bit repetitive, which I shouldn't blame on the new people but sometimes do anyway. Maybe we should setup a problem-determination-workflow/decision-tree or a Wiki with a FAQ or something.
 
Hello. Thank you for your replies. We use the default Replication of Proxmox, that syncronizes VMs between two Proxmox servers.​
I run the command arc_summary and it showed the following result. As it uses the full memory, the monitoring server always sends alerts.​

The result of arc_summary
Code:
root@PROX2:~# arc_summary

------------------------------------------------------------------------
ZFS Subsystem Report                            Mon Jul 03 10:59:23 2023
Linux 5.15.64-1-pve                                           2.1.6-pve1
Machine: PROX2 (x86_64)                                   2.1.6-pve1

ARC status:                                                      HEALTHY
        Memory throttle count:                                         0

ARC size (current):                                    85.5 %   26.8 GiB
        Target size (adaptive):                        86.8 %   27.2 GiB
        Min size (hard limit):                          6.2 %    2.0 GiB
        Max size (high water):                           16:1   31.3 GiB
        Most Frequently Used (MFU) cache size:         97.9 %   24.3 GiB
        Most Recently Used (MRU) cache size:            2.1 %  524.0 MiB
        Metadata cache size (hard limit):              75.0 %   23.5 GiB
        Metadata cache size (current):                 12.0 %    2.8 GiB
        Dnode cache size (hard limit):                 10.0 %    2.3 GiB
        Dnode cache size (current):                     0.1 %    2.9 MiB

ARC hash breakdown:
        Elements max:                                               8.2M
        Elements current:                              78.8 %       6.5M
        Collisions:                                                 4.6G
        Chain max:                                                    12
        Chains:                                                     1.5M

ARC misc:
        Deleted:                                                    1.9G
        Mutex misses:                                             580.3k
        Eviction skips:                                            73.9M
        Eviction skips due to L2 writes:                               0
        L2 cached evictions:                                     0 Bytes
        L2 eligible evictions:                                  16.4 TiB
        L2 eligible MFU evictions:                     32.1 %    5.3 TiB
        L2 eligible MRU evictions:                     67.9 %   11.1 TiB
        L2 ineligible evictions:                                 2.0 TiB

ARC total accesses (hits + misses):                                40.8G
        Cache hit ratio:                               95.2 %      38.8G
        Cache miss ratio:                               4.8 %       2.0G
        Actual hit ratio (MFU + MRU hits):             94.8 %      38.7G
        Data demand efficiency:                        95.0 %      25.0G
        Data prefetch efficiency:                      13.3 %     810.6M

Cache hits by cache type:
        Most frequently used (MFU):                    77.5 %      30.1G
        Most recently used (MRU):                      22.1 %       8.6G
        Most frequently used (MFU) ghost:               0.1 %      43.1M
        Most recently used (MRU) ghost:                 1.0 %     369.9M

Cache hits by data type:
        Demand data:                                   61.1 %      23.7G
        Demand prefetch data:                           0.3 %     108.0M
        Demand metadata:                               38.3 %      14.9G
        Demand prefetch metadata:                       0.4 %     161.1M

Cache misses by data type:
        Demand data:                                   63.6 %       1.3G
        Demand prefetch data:                          35.5 %     702.6M
        Demand metadata:                                0.3 %       6.2M
        Demand prefetch metadata:                       0.6 %      11.0M

DMU prefetch efficiency:                                           11.4G
        Hit ratio:                                      1.8 %     201.0M
        Miss ratio:                                    98.2 %      11.2G

L2ARC not detected, skipping section

Solaris Porting Layer (SPL):
        spl_hostid                                                     0
        spl_hostid_path                                      /etc/hostid
        spl_kmem_alloc_max 1048576
        spl_kmem_alloc_warn                                        65536
        spl_kmem_cache_kmem_threads                                    4
        spl_kmem_cache_magazine_size                                   0
        spl_kmem_cache_max_size                                       32
        spl_kmem_cache_obj_per_slab                                    8
        spl_kmem_cache_reclaim                                         0
        spl_kmem_cache_slab_limit                                  16384
        spl_max_show_tasks                                           512
        spl_panic_halt                                                 0
        spl_schedule_hrtimeout_slack_us                                0
        spl_taskq_kick                                                 0
        spl_taskq_thread_bind                                          0
        spl_taskq_thread_dynamic                                       1
        spl_taskq_thread_priority                                      1
        spl_taskq_thread_sequential                                    4

VDEV cache disabled, skipping section

ZIL committed transactions:                                         3.6G
        Commit requests:                                           51.3M
        Flushes to stable storage:                                 51.3M
        Transactions to SLOG storage pool:            0 Bytes          0
        Transactions to non-SLOG storage pool:       22.4 TiB     234.8M

I am also attaching the result of TOP sorted by memory usage.
 

Attachments

  • 2023-07-03 11_02_20-PROX2 - Proxmox Console.png
    2023-07-03 11_02_20-PROX2 - Proxmox Console.png
    227.5 KB · Views: 11
I have read the manual, used the command echo "$[10 * 1024*1024*1024]" >/sys/module/zfs/parameters/zfs_arc_max, now the momery usage is okay. And also added the command options zfs zfs_arc_max=8589934592 to /etc/modprobe.d/zfs.conf.
Thank you for your help.
 

About

The Proxmox community has been around for many years and offers help and support for Proxmox VE, Proxmox Backup Server, and Proxmox Mail Gateway.
We think our community is one of the best thanks to people like you!

Get your subscription!

The Proxmox team works very hard to make sure you are running the best software and getting stable updates and security enhancements, as well as quick enterprise support. Tens of thousands of happy customers have a Proxmox subscription. Get yours easily in our online shop.

Buy now!