HI,
I just updated my environment to pve 9
- 2 node cluster with no shared storage
- both host use the same hardware (Ryzen 5 5600G, same mb, same Memory (64Gib))
- some vms get replicated for HA
Now I have some weird issues with my virtual opnsense vm (FreeBSD) that was running fine before the upgrade. Wehen I start the VM on one node the memory usage goes to over 99% after a very short time and stays there. The management interface of the firewall reports around 23% usage for memory.


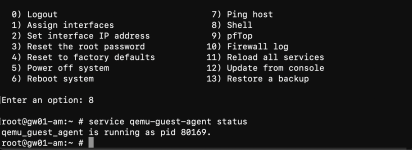
top inside the opnsense vm also reports around 23-25% mem usage.
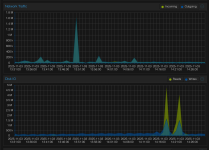
When I migrate the vm with HA to the other node also the CPU raises to over 100% (the peak was 126%) but only on the pve side. Inside the vm the cpu usage seems absolutely normal but all KVM processes on the host consume a lot of cpu.
Updating the opnsense to 25.7 did not resolve the problem
This is the vm config:
This is the only vm showing this behaviour after the upgrade. All other vms run as usual without any issues.
Any suggestions?
Thanks in advance
Andreas
I just updated my environment to pve 9
- 2 node cluster with no shared storage
- both host use the same hardware (Ryzen 5 5600G, same mb, same Memory (64Gib))
- some vms get replicated for HA
Now I have some weird issues with my virtual opnsense vm (FreeBSD) that was running fine before the upgrade. Wehen I start the VM on one node the memory usage goes to over 99% after a very short time and stays there. The management interface of the firewall reports around 23% usage for memory.
top inside the opnsense vm also reports around 23-25% mem usage.
When I migrate the vm with HA to the other node also the CPU raises to over 100% (the peak was 126%) but only on the pve side. Inside the vm the cpu usage seems absolutely normal but all KVM processes on the host consume a lot of cpu.
Updating the opnsense to 25.7 did not resolve the problem
This is the vm config:
Code:
agent: 1
balloon: 0
boot: order=sata0;sata1;net0
cores: 2
cpu: x86-64-v3
cpuunits: 200
machine: q35
memory: 8192
meta: creation-qemu=8.0.2,ctime=1690449616
name: vaultdoor
net0: virtio=22:E6:9F:,bridge=vmbr0
net1: virtio=9E:8E:A1,bridge=vmbr101
net2: virtio=66:C4:B9:,bridge=vmbr102
net3: virtio=56:38:97,bridge=vmbr0,tag=234
net4: virtio=7A:1F:12:,bridge=vmbr0,tag=122
numa: 0
onboot: 1
ostype: other
parent: Update_25_7
protection: 1
sata0: zfs-nvme:vm-666-disk-0,discard=on,size=100G
sata1: none,media=cdrom
scsihw: virtio-scsi-single
smbios1: uuid=64af0c63-
startup: order=1
tags: dns;firewall;network;nvme
vmgenid: 8560fd4a-

[Update_25_7]
agent: 1
balloon: 0
boot: order=sata0;sata1;net0
cores: 2
cpu: x86-64-v3
cpuunits: 200
machine: q35
memory: 8192
meta: creation-qemu=8.0.2,ctime=1690449616
name: vaultdoor
net0: virtio=22:E6:9F:,bridge=vmbr0
net1: virtio=9E:8E:A1:,bridge=vmbr101
net2: virtio=66:C4:B9:,bridge=vmbr102
net3: virtio=56:38:97:,bridge=vmbr0,tag=234
net4: virtio=7A:1F:12:,bridge=vmbr0,tag=122
numa: 0
onboot: 1
ostype: other
protection: 1
sata0: zfs-nvme:vm-666-disk-0,discard=on,size=100G
sata1: none,media=cdrom
scsihw: virtio-scsi-single
smbios1: uuid=64af0c63-
snaptime: 1754636475
sockets: 1
startup: order=1
tags: dns;firewall;network;nvme
vmgenid: 8560fd4a-2858-
This is the only vm showing this behaviour after the upgrade. All other vms run as usual without any issues.
Any suggestions?
Thanks in advance
Andreas
Last edited:

")