High IO-Load (txg_sync)

TechLineX

Active Member
Mar 2, 2015
213
5
38
Dear Support-Board,

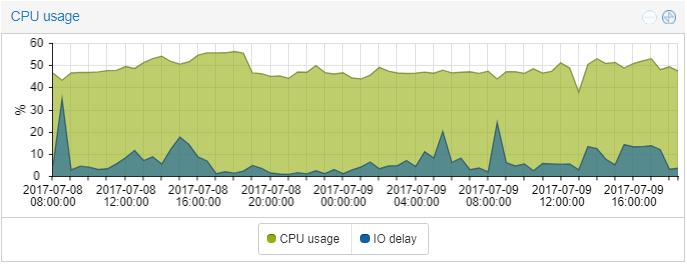
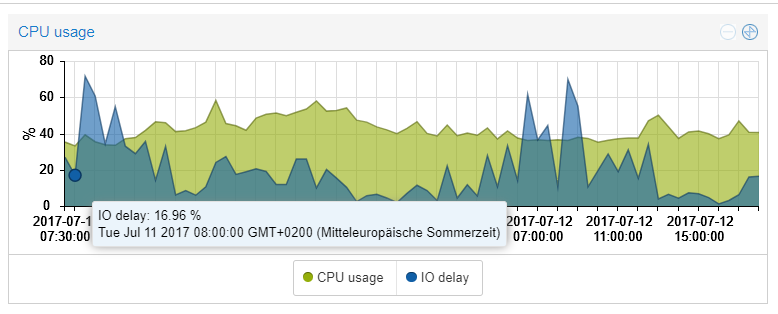
i´ve one host with a high io load since a few days. The highest process seems to be txg_sync (About 71% load)

- I use a RAID 1 with 2 discs:

Code:
root@host:~# zpool list
NAME    SIZE  ALLOC   FREE  EXPANDSZ   FRAG    CAP  DEDUP  HEALTH  ALTROOT
rpool  1.81T   503G  1.32T         -    39%    27%  1.00x  ONLINE  -
root@host:~# zpool iostat
               capacity     operations    bandwidth
pool        alloc   free   read  write   read  write
----------  -----  -----  -----  -----  -----  -----
rpool        503G  1.32T     15    291  1005K  5.35M

I searched for this in google and found it would hang together with the zfs. Is there anything to do sth against this?

Regards

Code:
root@host:~# pveversion -v
proxmox-ve: 4.4-84 (running kernel: 4.4.44-1-pve)
pve-manager: 4.4-12 (running version: 4.4-12/e71b7a74)
pve-kernel-4.4.6-1-pve: 4.4.6-48
pve-kernel-4.4.35-1-pve: 4.4.35-77
pve-kernel-4.4.44-1-pve: 4.4.44-84
lvm2: 2.02.116-pve3
corosync-pve: 2.4.2-2~pve4+1
libqb0: 1.0-1
pve-cluster: 4.0-48
qemu-server: 4.0-109
pve-firmware: 1.1-10
libpve-common-perl: 4.0-92
libpve-access-control: 4.0-23
libpve-storage-perl: 4.0-76
pve-libspice-server1: 0.12.8-2
vncterm: 1.3-1
pve-docs: 4.4-3
pve-qemu-kvm: 2.7.1-4
pve-container: 1.0-94
pve-firewall: 2.0-33
pve-ha-manager: 1.0-40
ksm-control-daemon: 1.2-1
glusterfs-client: 3.5.2-2+deb8u3
lxc-pve: 2.0.7-3
lxcfs: 2.0.6-pve1
criu: 1.6.0-1
novnc-pve: 0.5-8
smartmontools: 6.5+svn4324-1~pve80
zfsutils: 0.6.5.9-pve15~bpo80
 
Code:
root@host:~# zpool status
  pool: rpool
 state: ONLINE
  scan: scrub repaired 0 in 12h47m with 0 errors on Sun Jul  9 13:11:02 2017
config:

        NAME        STATE     READ WRITE CKSUM
        rpool       ONLINE       0     0     0
          mirror-0  ONLINE       0     0     0
            sda2    ONLINE       0     0     0
            sdb2    ONLINE       0     0     0

errors: No known data errors
 
Scrub is finished. IO load now is low ?

Not really:

YEIxeab.png
 
You have only two disks. i/o is at about 10% in average. This is normal. The CPUusage... don't know. Here must have a look at the processlist.
 
You have only two disks. i/o is at about 10% in average. This is normal. The CPUusage... don't know. Here must have a look at the processlist.

Ok. All hosts are setup the same, so i was wondering about this. If it´s normal, all is okay.

Thank you for your help. Regards
 
Most of the ZFS options is live changes. You can change sync and after test change back.

ZFS have two write strategy.

1. Asynchronize writes is flushed every ~5sec to the storage's from the write cache in ram (ZFS managed)
2. Synchronize is write to external ZIL (if you have attached) or to the same pool immediately. Later the data is flushed like #1 method again.

1. sync=disabled you will get all writes as async #1.
2. sync=standard the #1 and #2 will be used.
3. sync=always all writes (sync and async) will use #2

If changing sync to disabled and your IO loads will drop - Look for ZIL
 

About

The Proxmox community has been around for many years and offers help and support for Proxmox VE, Proxmox Backup Server, and Proxmox Mail Gateway.
We think our community is one of the best thanks to people like you!

Get your subscription!

The Proxmox team works very hard to make sure you are running the best software and getting stable updates and security enhancements, as well as quick enterprise support. Tens of thousands of happy customers have a Proxmox subscription. Get yours easily in our online shop.

Buy now!