High IO Delay and Unable to Login via Web Interface

colin1234

New Member
Jan 3, 2024
8
0
1
Okay, so here's a new one that I'm having trouble figuring out. For the last week or so it seems I can sometimes not login to the Web Interface. I get the "Unable to Login" error message. I've Googled and tried restarting services etc. via SSH and nothing seems to make a difference. It seems that after some time it will randomly just start working and allow me to login. I did notice this morning immediately before it allowed me to login I had some ridiculously high IO Delay. It seems it was sitting at 40%-50% IO Delay and then as soon as it dropped back to 5% or so I could login (see image below). When the issue is happening, all of the VMs and containers seem to behave with the exception of my Frigate container, which writes to a separate 8TB ZFS spinning disk. It is actually missing recordings at the same time that I am unable to login to the Web Interface.

-I have my boot drives setup as a 2-SSD ZFS Mirror and a separate 2-SSD ZFS Mirror for my VMs/Containers. The boot drives are consumer and the VM drives are Enterprise SSDs. I've verified that none of the partitions are running low on space.

-Running 8.3.0. I updated and rebooted about a week ago. It seems like *maybe* the problems started around then.

-Single Node

Can anyone point me in a direction that might help me find the root cause of this?
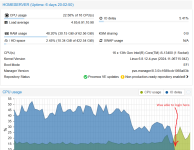
IODelay.png
 
Hi, try to get an idea of what is causing the IO delay?

iostat or atop should at least tell you which devices are in troubles, and what processes are impacted (though… it's probably VMs ;))

If you have another monitoring tool up, try to get insight there… And you can also use SMART to get some info about how "damaged" are your SSDs. ZFS (and Ceph) can hammer those quite a bit.

Proxmox processes tend to behave really bad when a storage starts acting up, so that could be improved, maybe… But you probably have an actual hardware issue there.
 
I'm experiencing this issue with Proxmox 8.4.0 on a relatively low power machine (Dual Celeron 2957U @ 1.40GHz, 8 GB RAM).

I know what causes the IO load: I have a Zpool on a USB3 HDD and whenever I do IO tasks on that pool, the system becomes unresponsive:
  • Web Login takes a long time before failing
  • SSH login takes multiple attempts but usually succeeds
  • SSH commands are very sluggish.
  • Top says load is above 10, z_rd_int takes 75-90% cpu (the rest is taken by my IO-task)
  • free says:
  • Code:
                   total        used        free      shared  buff/cache   available
    Mem:           7.7Gi       4.9Gi       2.8Gi        24Mi       195Mi       2.7Gi
    Swap:          7.5Gi       1.4Gi       6.1Gi
  • ZFS Arch is limited to 4GB (maybe I should reduce that?)
  • iotop shows the occasional SWAPIN for various processes
I have no VMs, just a bunch of containers (NFS, SMB, Transmission, PiHole)
The OS+SWAP is on a separate internal HDD
I'm not sure why the system is swapping though. my containers are assigned little memory, top shows corosync the biggest user with 2.1% of 8 GB.
I cannot login on the web to check the containers. themselves.

I Understand the load and all, but what can I do to "tune" the system to remain responsive when I do things like extracting an archive or reading & check-summing large amount of files on the Zpool USB HDD? It doesn't make sense that a hypervisor system becomes unresponsive if a single disk is under load, right?

EDIT: Suspecting the issue was swap related:
  1. I reduced the ZFS arc from 4GB to 3GB,
  2. set sysctl vm.swappiness=1
  3. swapoff -a (this took a few minutes to complete)
  4. swapon -a
Then I re-ran my IO intensive task and while the IO delay in the GUI showed 15-20%, the SSH terminal remained responsive and no more swapping.
The Memory usage is still quite high. I am not sure what takes so much memory. My containers are assigned 2.5GB and they use 15% - 20% of it (but were more than happy to swap!)
 
Last edited: