High I/O Delay

mladenciric

Member
Mar 25, 2021
23
0
6
44
Hello everyone,
We experience strange behavior on one PVE host in our cluster. Our cluster have only three hosts. Hosts are not brand name servers they are custom made desktops. They are not the same hardware but they are very similar. All hosts have the same version of pve, latest uptades from no-production repositories - version is listed bellow
Code:
proxmox-ve: 7.4-1 (running kernel: 5.15.131-2-pve)
pve-manager: 7.4-17 (running version: 7.4-17/513c62be)
pve-kernel-5.15: 7.4-9
pve-kernel-5.4: 6.4-19
pve-kernel-5.15.131-2-pve: 5.15.131-3
pve-kernel-5.15.131-1-pve: 5.15.131-2
pve-kernel-5.15.126-1-pve: 5.15.126-1
pve-kernel-5.4.195-1-pve: 5.4.195-1
pve-kernel-5.4.106-1-pve: 5.4.106-1
ceph-fuse: 14.2.21-1
corosync: 3.1.7-pve1
criu: 3.15-1+pve-1
glusterfs-client: 9.2-1
ifupdown: not correctly installed
ifupdown2: 3.1.0-1+pmx4
ksm-control-daemon: 1.4-1
libjs-extjs: 7.0.0-1
libknet1: 1.24-pve2
libproxmox-acme-perl: 1.4.4
libproxmox-backup-qemu0: 1.3.1-1
libproxmox-rs-perl: 0.2.1
libpve-access-control: 7.4.1
libpve-apiclient-perl: 3.2-1
libpve-common-perl: 7.4-2
libpve-guest-common-perl: 4.2-4
libpve-http-server-perl: 4.2-3
libpve-rs-perl: 0.7.7
libpve-storage-perl: 7.4-3
libqb0: 1.0.5-1
libspice-server1: 0.14.3-2.1
lvm2: 2.03.11-2.1
lxc-pve: 5.0.2-2
lxcfs: 5.0.3-pve1
novnc-pve: 1.4.0-1
proxmox-backup-client: 2.4.4-1
proxmox-backup-file-restore: 2.4.4-1
proxmox-kernel-helper: 7.4-1
proxmox-mail-forward: 0.1.1-1
proxmox-mini-journalreader: 1.3-1
proxmox-offline-mirror-helper: 0.5.2
proxmox-widget-toolkit: 3.7.3
pve-cluster: 7.3-3
pve-container: 4.4-6
pve-docs: 7.4-2
pve-edk2-firmware: 3.20230228-4~bpo11+1
pve-firewall: 4.3-5
pve-firmware: 3.6-6
pve-ha-manager: 3.6.1
pve-i18n: 2.12-1
pve-qemu-kvm: 7.2.0-8
pve-xtermjs: 4.16.0-2
qemu-server: 7.4-4
smartmontools: 7.2-pve3
spiceterm: 3.2-2
swtpm: 0.8.0~bpo11+3
vncterm: 1.7-1
zfsutils-linux: 2.1.14-pve1
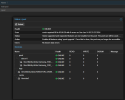
Storages on this hosts are as this: two SSD for hypervisor system and some pct and vms, one ssd partitioned and partition used as cache and logs, two HDDs for all others vms and pcts and for local backup. On each host Two ssd are organized as zfs raid mirror, and two hdd are also organized as zfs raid mirror. [See picture bellow]
pm3 problem0.png

Two host have 32 GB of RAM (max. by mobo), and third have 64 GB (max. by mobo)

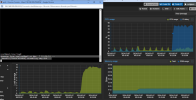
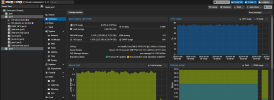
What is strange is that on one host , which i call pm3 (screen shots posted here are for that host), have high I/O as high as more than 50%, EVEN IF NO running virtual machines or containers on that host. As you can see at picture bellow:
pm3 problem.png
When we turn off and turn on , or reboot/restart, this host it starts normal and work ok for some time (maybe 12h) but after that I/O starts to grow not so fast but after 24h it is on the level you can see on picture, without running anything by system itself.
If we reboot it again this behavior repeats.
The host with that high I/O Delay become slow , irresponsible for any action and sometime other cluster nods don't see that host (red cross icon on web gui).
If we try to start some vms or pct , when system was previously rebooted, it works fine but how time goes they start to be slow and difficult to work with it?
Also new installation od vms was slow as well as host updates.

We check disks by SMART and it says that they are ok.

Please any suggestion how to find what is the problem an how to resolve ?
 
UPDATE
I just figured out that when this message appear at console of this host I/O Delay go high
Message from syslogd@pm3 at Mar 6 09:44:06 ...
kernel:[ 6464.508481] Disabling IRQ #19
That happened about 2 hour after restart host.
Further inspection using
cat /proc/interrupts
19: 0 0 710586 0 IR-IO-APIC 19-fasteoi ata_piix, ata_piix, enp4s0
which tells me that kernel disable IRQ who is in charge of ATA controller and also for on NIC.

cat /var/log/syslog
Mar 6 09:43:54 pm3 pmxcfs[2131]: [status] notice: received log
Mar 6 09:44:06 pm3 kernel: [ 6464.508300] irq 19: nobody cared (try booting with the "irqpoll" option)
Mar 6 09:44:06 pm3 kernel: [ 6464.508332] CPU: 2 PID: 0 Comm: swapper/2 Tainted: P O 5.15.143-1-pve #1
Mar 6 09:44:06 pm3 kernel: [ 6464.508335] Hardware name: MSI MS-7750/Z68A-G43 (G3) (MS-7750), BIOS V5.0 04/19/2012
Mar 6 09:44:06 pm3 kernel: [ 6464.508336] Call Trace:
Mar 6 09:44:06 pm3 kernel: [ 6464.508338] <IRQ>
Mar 6 09:44:06 pm3 kernel: [ 6464.508341] dump_stack_lvl+0x4a/0x63
Mar 6 09:44:06 pm3 kernel: [ 6464.508347] dump_stack+0x10/0x16
Mar 6 09:44:06 pm3 kernel: [ 6464.508348] __report_bad_irq+0x3a/0xb3
Mar 6 09:44:06 pm3 kernel: [ 6464.508352] note_interrupt.cold+0xb/0x60
Mar 6 09:44:06 pm3 kernel: [ 6464.508354] handle_irq_event+0xa8/0xb0
Mar 6 09:44:06 pm3 kernel: [ 6464.508358] handle_fasteoi_irq+0x7d/0x1d0
Mar 6 09:44:06 pm3 kernel: [ 6464.508360] __common_interrupt+0x52/0xe0
Mar 6 09:44:06 pm3 kernel: [ 6464.508363] common_interrupt+0x89/0xa0
Mar 6 09:44:06 pm3 kernel: [ 6464.508367] </IRQ>
Mar 6 09:44:06 pm3 kernel: [ 6464.508367] <TASK>
Mar 6 09:44:06 pm3 kernel: [ 6464.508368] asm_common_interrupt+0x27/0x40
Mar 6 09:44:06 pm3 kernel: [ 6464.508370] RIP: 0010:cpuidle_enter_state+0xd9/0x620
Mar 6 09:44:06 pm3 kernel: [ 6464.508374] Code: 3d cc e3 3d 46 e8 87 b5 6c ff 49 89 c7 0f 1f 44 00 00 31 ff e8 c8 c2 6c ff 80 7d d0 00 0f 85 5e 01 00 00 fb 66 0f 1f 44 00 00 <45> 85 f6 0f 88 6a 01 00 00 4d 63 ee 49 83 fd 09 0f 87 e5 03 00 00
Mar 6 09:44:06 pm3 kernel: [ 6464.508376] RSP: 0018:ffffa345000bbe38 EFLAGS: 00000246
Mar 6 09:44:06 pm3 kernel: [ 6464.508378] RAX: ffff8a727f331500 RBX: ffffc344ffd19100 RCX: 0000000000000000
Mar 6 09:44:06 pm3 kernel: [ 6464.508379] RDX: 00000000000002f2 RSI: 0000000027ffedfa RDI: 0000000000000000
Mar 6 09:44:06 pm3 kernel: [ 6464.508380] RBP: ffffa345000bbe88 R08: 000005e122b879a5 R09: 000005e143d7da00
Mar 6 09:44:06 pm3 kernel: [ 6464.508381] R10: 000005e12e25a700 R11: 071c71c71c71c71c R12: ffffffffbb2d6f60
Mar 6 09:44:06 pm3 kernel: [ 6464.508382] R13: 0000000000000004 R14: 0000000000000004 R15: 000005e122b879a5
Mar 6 09:44:06 pm3 kernel: [ 6464.508384] ? cpuidle_enter_state+0xc8/0x620
Mar 6 09:44:06 pm3 kernel: [ 6464.508386] cpuidle_enter+0x2e/0x50
Mar 6 09:44:06 pm3 kernel: [ 6464.508388] do_idle+0x20d/0x2b0
Mar 6 09:44:06 pm3 kernel: [ 6464.508391] cpu_startup_entry+0x20/0x30
Mar 6 09:44:06 pm3 kernel: [ 6464.508393] start_secondary+0x12a/0x180
Mar 6 09:44:06 pm3 kernel: [ 6464.508396] secondary_startup_64_no_verify+0xc2/0xcb
Mar 6 09:44:06 pm3 kernel: [ 6464.508400] </TASK>
Mar 6 09:44:06 pm3 kernel: [ 6464.508400] handlers:
Mar 6 09:44:06 pm3 kernel: [ 6464.508413] [<00000000af34c0d7>] ata_bmdma_interrupt
Mar 6 09:44:06 pm3 kernel: [ 6464.508436] [<00000000af34c0d7>] ata_bmdma_interrupt
Mar 6 09:44:06 pm3 kernel: [ 6464.508456] [<00000000eae2d769>] rtl8169_interrupt [r8169]
Mar 6 09:44:06 pm3 kernel: [ 6464.508481] Disabling IRQ #19


Can anyone help me how to solve this.
 
Last edited:
UPDATE
Definitely, the time when this happened isn't same.
The host works almost 20 hours without any issue but also without any load (no vm running no lxc running).
This morning I start one lxc container and one vm both linux/debian guests which use HHD storage. After one and a half hour of working same issue appearing.
Again kernel disable IRQ#19 was happened how was shown in previous post.
As you can see on screenshot below IO Delay go high and Load average also go high.
pm3_irq19.png
Then this host get slow and almost inaccessible.
Till now I don't know what triggers kernel action to disable irq19 which is obviously in charge for ATA/SATA controller on the MOBO and I don't find solution for this.
I will appreciate any suggestion from community.
Regards
 
Last edited:
I would try a few of things:

- Update BIOS.

- Install CPU updated microcode
vim /etc/apt/sources.list

Code:
deb [...] bullseye main contrib non-free
deb [...] bullseye-updates main contrib non-free
deb [...] bullseye-security main contrib non-free

apt update && apt install intel-microcode
reboot

- Install kernel 6.2 (apt install pve-kernel-6.2) and see if there's any difference.

- Enable IOMMU by adding intel_iommu=on intel_iommu=pt to your boot kernel cmdline. How to do it depends on the bootloader used [1]

[1] https://pve.proxmox.com/wiki/Host_Bootloader#sysboot_determine_bootloader_used
 
Thank you Victor for prompt response.
How you recommend to try what you suggest.
To change one by one or to make all changes at once?.

First thing first
BIOS: first thing I was do when issue appear is to update BIOS.
The BIOS for this MoBo is quite old as MoBo itself. But it is latest available from MSI support page which is installed on this host.
1709814968301.png
I can try to do the second and third because I haven't tried it so far.

Forth, iommu, was enabled earlier, I use grub bootloader, but I need to add intel_iommu=pt sentence to my grub.
 
Last edited:
UPDATE - POSSIBLE SOLUTION
After some time, I found time to try again to solve this problem.
I use following command to inspect irq19 and to find which hardware may cause this problem
1. dmesg
this showing me among others
irq 19: nobody cared (try booting with the "irqpoll" option)

2. cat /proc/interrupts
this shows me
19: 0 0 4123227 0 IR-IO-APIC 19-fasteoi ata_piix, ata_piix, enp4s0

3. cat /proc/irg19
here I found nothing, blank output
4. lspci -vv
this shows me details about enp4s0 , because i assume that NIC is faulty, or drivers problem (i found on the forum that proxmox may have problems with Realtek drivers), but that is not the case
I skip couple of time to carefully read line by line output of dmesg command, but after some time i notice that quoted line clearly suggest to boot with irqpoll option
I do some reading about that and found (out of this forum) that that may be solution and I give it a try.
Change grub line, at the end of the line (line which have quiet at the end) I add irqpoll
sudo nano /etc/default/grub
line in grub file may looks like:
GRUB_CMDLINE_LINUX_DEFAULT="quiet intel_iommu=on intel_iommu=pt irqpoll"

Update grub
sudo update-grub
and repeat update with
sudo proxmox-boot-tool refresh

The result is that more than 24h proxmox host was working without issue but also without load *no qm, no pct running*
Now I start to test with load *one container and one virtual machine running*. I hope so that the problem is solved.

Note: someone says that irqpoll is not real solution, but for me, for now it is god enough.

If somebody knows better solution and/or have some clue or recommendation I am open to hear.
 
Last edited:

About

The Proxmox community has been around for many years and offers help and support for Proxmox VE, Proxmox Backup Server, and Proxmox Mail Gateway.
We think our community is one of the best thanks to people like you!

Get your subscription!

The Proxmox team works very hard to make sure you are running the best software and getting stable updates and security enhancements, as well as quick enterprise support. Tens of thousands of happy customers have a Proxmox subscription. Get yours easily in our online shop.

Buy now!