High CPU on 2 nodes since sunday 14/04 17h???

Oct 18, 2017
23
5
43
48
france
hello all

i'm facing a very strange problem, and cannot find the cause.

on 01/04 , i've migrate my old cluster (proxmox 7) to new hardware (two DELL R250, one T430, all with 32Go ram) with proxmox 8, all fine, all my vm run smoothly.
the two R250 have OS on a ssd, and use ZFS for storage, one node with two ssd in RAID O, the other with two HDD in RAID 0, with some's vm replicated (no HA) beetween theses nodes.
the T430 have OS on a ssd and storage on a harware raid5.

sunday 14/04, I started having problems with one vm (zimbra) on a R250, suddenly it started using 200% of the guest cpu (java process eat all cpu) and became extremely slow.
i suspect a zimbra bug, but after a long time to search for something wrong, nothing.

to make a test suggested on zimbra forum regarding zfs, i've finally make a backup of this vm for transfering it on another node without zfs.
first strange things, backup extremely slow, take 3 hours for finish, previous backup (one day before) take only less than 15 minutes.
after restore on the T430, all zimbra problem disapear!

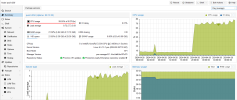
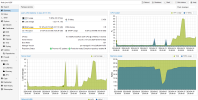
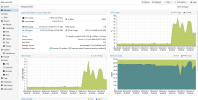
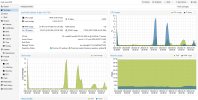
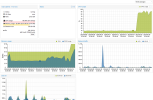
so, i've check my nodes, and i've discover than since two days (sunday 17h), all vm on the two nodes with zfs have cpu use growing! (but not enough to generate a problem, unlik with the zimbra server), see attached screens.

for example, a vm that previously used 5% cpu now uses 15%.


Code:
root@pve1-r250:~# zpool status
  pool: zfs
 state: ONLINE
  scan: scrub repaired 0B in 00:47:10 with 0 errors on Sun Apr 14 01:11:11 2024
config:

        NAME        STATE     READ WRITE CKSUM
        zfs         ONLINE       0     0     0
          sdb       ONLINE       0     0     0
          sdc       ONLINE       0     0     0

errors: No known data errors

same on the second node.
and no replication job error

bur it's the first time i use zfs, so i'm outside of my comfort zone :)

help?

Code:
root@pve2-r250:~# pveversion
pve-manager/8.1.4/ec5affc9e41f1d79 (running kernel: 6.5.13-1-pve)
 

Attachments

  • pve1-r250.png
    pve1-r250.png
    117.6 KB · Views: 3
  • pve2-r250.png
    pve2-r250.png
    116 KB · Views: 4
  • pve3-t430.png
    pve3-t430.png
    119.6 KB · Views: 4
  • zimbra.png
    zimbra.png
    166.3 KB · Views: 4
Last edited:
ZFS can impact heavily on CPU usage. There maybe ZFS scrubs/backups/replications going on, which will further impact the CPU usage.
 
hum i can understand that zfs impact cpu use on the host, but why on the guest?
Firstly, even on a Hypervisor - Always remember It's all the same CPU.

Secondly I don't know anything about your Zimbra VM setup/config except that its also running on ZFS. So impact is inevitable. Its even possible - you have major write amplification with one FS in another one. What is the general write activity of the VM? I believe it uses DBs for a mailbox structure. Probably a high write activity + logging.

IDK much about Zimbra at all, but as far as I know its already EOL (open source).
 
ok, makes sense for a mail server, but i can see the same thing for my DC (Samba ad only, nothing more, on debian 11)
previously never more than 1%, now 9-10% ?

with absolutely no change.DC1.png
 
In trying to analyze your situation:

sunday 14/04, I started having problems with one vm (zimbra) on a R250, suddenly it started using 200% of the guest cpu (java process eat all cpu) and became extremely slow.
From the images you have posted; it can be noted that "some event" began on that day at approx. 7pm. Can you recollect/associate what this may have been? Backup/replication etc.? Have you checked logs/journal for that period?
 
yes, find nothing specifique, no backup/replication at this time.
only backup very early sunday, ended before 12:00
no replication during week-end

Code:
root@pve2-r250:~# journalctl --since "2024-04-14 16:00:00" --until "2024-04-14 21:00:00"
Apr 14 16:11:20 pve2-r250 pmxcfs[1119]: [status] notice: received log
Apr 14 16:17:01 pve2-r250 CRON[1697100]: pam_unix(cron:session): session opened for user root(uid=0) by (uid=0)
Apr 14 16:17:01 pve2-r250 CRON[1697101]: (root) CMD (cd / && run-parts --report /etc/cron.hourly)
Apr 14 16:17:01 pve2-r250 CRON[1697100]: pam_unix(cron:session): session closed for user root
Apr 14 16:26:21 pve2-r250 pmxcfs[1119]: [status] notice: received log
Apr 14 16:34:25 pve2-r250 pmxcfs[1119]: [dcdb] notice: data verification successful
Apr 14 16:41:21 pve2-r250 pmxcfs[1119]: [status] notice: received log
Apr 14 16:56:22 pve2-r250 pmxcfs[1119]: [status] notice: received log
Apr 14 17:03:35 pve2-r250 smartd[812]: Device: /dev/sdb [SAT], SMART Usage Attribute: 190 Airflow_Temperature_Cel changed from 71 to 70
Apr 14 17:03:35 pve2-r250 smartd[812]: Device: /dev/sdc [SAT], SMART Usage Attribute: 190 Airflow_Temperature_Cel changed from 71 to 70
Apr 14 17:11:22 pve2-r250 pmxcfs[1119]: [status] notice: received log
Apr 14 17:14:13 pve2-r250 pvestatd[1227]: auth key pair too old, rotating..
Apr 14 17:17:01 pve2-r250 CRON[1708091]: pam_unix(cron:session): session opened for user root(uid=0) by (uid=0)
Apr 14 17:17:01 pve2-r250 CRON[1708092]: (root) CMD (cd / && run-parts --report /etc/cron.hourly)
Apr 14 17:17:01 pve2-r250 CRON[1708091]: pam_unix(cron:session): session closed for user root
Apr 14 17:26:22 pve2-r250 pmxcfs[1119]: [status] notice: received log
Apr 14 17:34:25 pve2-r250 pmxcfs[1119]: [dcdb] notice: data verification successful
Apr 14 17:41:23 pve2-r250 pmxcfs[1119]: [status] notice: received log
Apr 14 18:17:01 pve2-r250 CRON[1719000]: pam_unix(cron:session): session opened for user root(uid=0) by (uid=0)
Apr 14 18:17:01 pve2-r250 CRON[1719001]: (root) CMD (cd / && run-parts --report /etc/cron.hourly)
Apr 14 18:17:01 pve2-r250 CRON[1719000]: pam_unix(cron:session): session closed for user root
Apr 14 18:34:25 pve2-r250 pmxcfs[1119]: [dcdb] notice: data verification successful
Apr 14 18:41:58 pve2-r250 kernel: perf: interrupt took too long (4021 > 3973), lowering kernel.perf_event_max_sample_rate to 49500
Apr 14 19:03:35 pve2-r250 smartd[812]: Device: /dev/sda [SAT], SMART Usage Attribute: 190 Airflow_Temperature_Cel changed from 69 to 68
Apr 14 19:10:27 pve2-r250 kernel: perf: interrupt took too long (5035 > 5026), lowering kernel.perf_event_max_sample_rate to 39500
Apr 14 19:17:01 pve2-r250 CRON[1730003]: pam_unix(cron:session): session opened for user root(uid=0) by (uid=0)
Apr 14 19:17:01 pve2-r250 CRON[1730004]: (root) CMD (cd / && run-parts --report /etc/cron.hourly)
Apr 14 19:17:01 pve2-r250 CRON[1730003]: pam_unix(cron:session): session closed for user root
Apr 14 19:34:25 pve2-r250 pmxcfs[1119]: [dcdb] notice: data verification successful
Apr 14 19:48:56 pve2-r250 kernel: perf: interrupt took too long (6313 > 6293), lowering kernel.perf_event_max_sample_rate to 31500
Apr 14 20:17:01 pve2-r250 CRON[1740953]: pam_unix(cron:session): session opened for user root(uid=0) by (uid=0)
Apr 14 20:17:01 pve2-r250 CRON[1740954]: (root) CMD (cd / && run-parts --report /etc/cron.hourly)
Apr 14 20:17:01 pve2-r250 CRON[1740953]: pam_unix(cron:session): session closed for user root
Apr 14 20:34:25 pve2-r250 pmxcfs[1119]: [dcdb] notice: data verification successful
Apr 14 20:41:01 pve2-r250 kernel: perf: interrupt took too long (7959 > 7891), lowering kernel.perf_event_max_sample_rate to 25000

maybe this is problematic?

Code:
root@pve1-r250:~# journalctl | grep kernel.perf
Apr 07 05:23:46 pve1-r250 kernel: perf: interrupt took too long (2506 > 2500), lowering kernel.perf_event_max_sample_rate to 79750
Apr 08 03:10:51 pve1-r250 kernel: perf: interrupt took too long (2505 > 2500), lowering kernel.perf_event_max_sample_rate to 79750
Apr 08 16:29:05 pve1-r250 kernel: perf: interrupt took too long (3146 > 3131), lowering kernel.perf_event_max_sample_rate to 63500
Apr 14 02:58:37 pve1-r250 kernel: perf: interrupt took too long (2600 > 2500), lowering kernel.perf_event_max_sample_rate to 76750
Apr 14 03:41:10 pve1-r250 kernel: perf: interrupt took too long (3251 > 3250), lowering kernel.perf_event_max_sample_rate to 61500
Apr 14 19:58:06 pve1-r250 kernel: perf: interrupt took too long (4075 > 4063), lowering kernel.perf_event_max_sample_rate to 49000
Apr 14 22:17:34 pve1-r250 kernel: perf: interrupt took too long (5171 > 5093), lowering kernel.perf_event_max_sample_rate to 38500
Apr 15 01:24:15 pve1-r250 kernel: perf: interrupt took too long (6512 > 6463), lowering kernel.perf_event_max_sample_rate to 30500
Apr 15 06:22:04 pve1-r250 kernel: perf: interrupt took too long (8209 > 8140), lowering kernel.perf_event_max_sample_rate to 24250
Apr 15 11:44:36 pve1-r250 kernel: perf: interrupt took too long (10278 > 10261), lowering kernel.perf_event_max_sample_rate to 19250
Apr 15 19:02:49 pve1-r250 kernel: perf: interrupt took too long (12881 > 12847), lowering kernel.perf_event_max_sample_rate to 15500
Apr 16 00:36:08 pve1-r250 kernel: perf: interrupt took too long (16154 > 16101), lowering kernel.perf_event_max_sample_rate to 12250
 
hum, on second node :

Code:
root@pve2-r250:~# journalctl | grep kernel.perf
Apr 06 18:40:01 pve2-r250 kernel: perf: interrupt took too long (2502 > 2500), lowering kernel.perf_event_max_sample_rate to 79750
Apr 06 22:51:51 pve2-r250 kernel: perf: interrupt took too long (3151 > 3127), lowering kernel.perf_event_max_sample_rate to 63250
Apr 07 23:18:01 pve2-r250 kernel: perf: interrupt took too long (2507 > 2500), lowering kernel.perf_event_max_sample_rate to 79750
Apr 08 02:28:02 pve2-r250 kernel: perf: interrupt took too long (2503 > 2500), lowering kernel.perf_event_max_sample_rate to 79750
Apr 08 10:14:52 pve2-r250 kernel: perf: interrupt took too long (3179 > 3128), lowering kernel.perf_event_max_sample_rate to 62750
Apr 14 18:41:58 pve2-r250 kernel: perf: interrupt took too long (4021 > 3973), lowering kernel.perf_event_max_sample_rate to 49500
Apr 14 19:10:27 pve2-r250 kernel: perf: interrupt took too long (5035 > 5026), lowering kernel.perf_event_max_sample_rate to 39500
Apr 14 19:48:56 pve2-r250 kernel: perf: interrupt took too long (6313 > 6293), lowering kernel.perf_event_max_sample_rate to 31500
Apr 14 20:41:01 pve2-r250 kernel: perf: interrupt took too long (7959 > 7891), lowering kernel.perf_event_max_sample_rate to 25000
Apr 14 21:53:37 pve2-r250 kernel: perf: interrupt took too long (9987 > 9948), lowering kernel.perf_event_max_sample_rate to 20000
Apr 14 23:41:05 pve2-r250 kernel: perf: interrupt took too long (12513 > 12483), lowering kernel.perf_event_max_sample_rate to 15750
Apr 15 02:38:54 pve2-r250 kernel: perf: interrupt took too long (15684 > 15641), lowering kernel.perf_event_max_sample_rate to 12750
Apr 15 09:41:32 pve2-r250 kernel: perf: interrupt took too long (19630 > 19605), lowering kernel.perf_event_max_sample_rate to 10000
Apr 15 14:32:37 pve2-r250 kernel: perf: interrupt took too long (2557 > 2500), lowering kernel.perf_event_max_sample_rate to 78000
Apr 15 15:12:07 pve2-r250 kernel: perf: interrupt took too long (3312 > 3196), lowering kernel.perf_event_max_sample_rate to 60250
Apr 15 15:36:23 pve2-r250 kernel: perf: interrupt took too long (4263 > 4140), lowering kernel.perf_event_max_sample_rate to 46750
Apr 15 16:08:43 pve2-r250 kernel: perf: interrupt took too long (5333 > 5328), lowering kernel.perf_event_max_sample_rate to 37500
Apr 15 16:53:10 pve2-r250 kernel: perf: interrupt took too long (6726 > 6666), lowering kernel.perf_event_max_sample_rate to 29500
Apr 15 18:06:48 pve2-r250 kernel: perf: interrupt took too long (8413 > 8407), lowering kernel.perf_event_max_sample_rate to 23750
Apr 15 19:19:20 pve2-r250 kernel: perf: interrupt took too long (10550 > 10516), lowering kernel.perf_event_max_sample_rate to 18750
Apr 15 21:25:04 pve2-r250 kernel: perf: interrupt took too long (13252 > 13187), lowering kernel.perf_event_max_sample_rate to 15000
Apr 16 01:01:36 pve2-r250 kernel: perf: interrupt took too long (16593 > 16565), lowering kernel.perf_event_max_sample_rate to 12000
Apr 16 15:20:28 pve2-r250 kernel: perf: interrupt took too long (20752 > 20741), lowering kernel.perf_event_max_sample_rate to 9500
 
These messages are informational only - but their lowering rate is symptomatic of whatever is causing this. So; they do not show the root cause of why you have a higher CPU usage - but when your CPU usage goes up - these messages will show. (In brief it concerns sampling rates for perf which is the kernel's monitoring system). I believe they could also be symptomatic of CPU frequency scaling.

IDK where your servers are located or what the hardware setup is, but maybe somethings gone wrong with the cooling? I know its unlikely 2 separate servers should be dependent on one system, but I'm just throwing it out there. Check the racks/enclosure.

Secondly, I understand your Zimbra VM is now running on the T430, & I guess its shutdown on the other node/s. Is the CPU usage still currently a problem on the other servers/nodes?

Have you rebooted these servers since stopping the VMs on them?
 
nope, no cooling problem.
Code:
root@pve1-r250:~# sensors
coretemp-isa-0000
Adapter: ISA adapter
Package id 0:  +40.0°C  (high = +90.0°C, crit = +100.0°C)

root@pve2-r250:~# sensors
coretemp-isa-0000
Adapter: ISA adapter
Package id 0:  +36.0°C  (high = +90.0°C, crit = +100.0°C)

root@pve3-t430:~# sensors
coretemp-isa-0000
Adapter: ISA adapter
Package id 0:  +34.0°C  (high = +82.0°C, crit = +92.0°C)
Core 0:        +28.0°C  (high = +82.0°C, crit = +92.0°C)

and yes, cpu usage problem still remain on pve1 & 2.
i've rebooted pve2 (server with zimbra vm) one day ago, but not since i've move the vm.
I've disabled replication now, in case of, I will restart the server
 
  • Like
Reactions: gfngfn256
so, after a reboot of all nodes, the situation is back to normal, no more high cpu usage
not sure if it's because of the reboot or because of the replication tasks deleted, but problem solved apparently:)

it's just a shame that there's nothing in the proxmox logs, because then we'll never know what happened.
maybe something to do with replication, but what... :)
but thanks for the help!
 
Last edited:
Hello
the problem just happened again :(
and more or less at the same time, sunday 7pm.
reboot all nodes not solve the problem.
but now I have a clearer idea of the cause, it's somethink caused by an interaction between one of my VMs (the one with zimbra) and the ZFS or the nfs share used for backup.
since the 17th (after the first bug, "solved" by moving the vm to another node without zfs and reboot cluster), my zimbra vm has been running on the node without zfs, without any problem.
last friday (27/04), i've moved again this vm to its original node (with zfs) to make a test, and no problem, vm run smoothly, no cpu charge.
until yesterday 7pm...
and since the only thing that happens on Sunday is the backup of the vm, I'm inclined to think that something happens a few hours after the backup that causes this problem, but what?
clearly something linked to the zimbra vm, because the previous sunday (with zimbra vm on nfs server node) , the vm backup did not cause this problem.
and it's not related to replication, since I haven't re-enabled that feature yet.
and probably not something related to zfs, because even if the problem appears on the 2 zfs nodes, there is no longer any replication between the 2, so there's no reason for the 2 zfs pools to be affected.
the only thing common to these 2 nodes is the nfs share, is it possible that the backup is causing a bug on node 3 (the nfs server), and that this is what is making the other 2 nodes so slow?
the backup is made on an nfs share, which is on the node without zfs, via a "poor man's" 2.5Gb/s link, using TP-link TX-201 network cards.
 

Attachments

  • Capture d'écran 2024-04-29 105448.png
    Capture d'écran 2024-04-29 105448.png
    91.3 KB · Views: 2
Last edited:
Wednesday (it's a holiday in my country) I'm going to do another test, put the vm back on one of the nodes with zfs and an nfs share, and do a backup again, but this time using the "normal" network and not the 2.5Gb link, just to see if it makes a difference....
 
Last edited:
ok, so doing a live migration of the zimbra vm to the 3rd node (DELL T430) , then restarting the cluster solved the problem again.
but I just noticed something.
when I restarted the cluster this morning for the first time (without having moved the vm), I had the impression that the first 2 nodes (the DELL R250s) were rather slow to start up, not during the post but when proxmox was launched.
this time (after moving the vm), instead of rebooting the servers, I turned them off, waited 10-15 seconds and then restarted them.
and clearly this time, on the 2 R250s, proxmox started much faster.
It's starting to look like a kernel bug, isn't it?
maybe a problem with the TX201 drivers?
but if so, where to look (which logs) to confirm it?

attached you can find the full log of the pve2-r250 (node with zimbra vm) from sunday 0.00h to now, same for pve1 and pv3.
VM 109 is zimbra vm
first cluster reboot (without real shutdown) 29/04 at 10:33
second reboot with 10-15s complete halt at 12:37
i've started live migration of the vm to t430 at 11:09
 

Attachments

  • pve1-R250.txt
    477.2 KB · Views: 0
  • pve2-R250.txt
    517.3 KB · Views: 0
  • pve3-T430.txt
    561.5 KB · Views: 0
Last edited:

About

The Proxmox community has been around for many years and offers help and support for Proxmox VE, Proxmox Backup Server, and Proxmox Mail Gateway.
We think our community is one of the best thanks to people like you!

Get your subscription!

The Proxmox team works very hard to make sure you are running the best software and getting stable updates and security enhancements, as well as quick enterprise support. Tens of thousands of happy customers have a Proxmox subscription. Get yours easily in our online shop.

Buy now!