high CPU load.

corianito

Active Member
Jul 20, 2019
43
0
26
37
Hello!

I have a server with a pretty powerful processor, so I shouldn't have any problems. (At least that's what I think).

The fact is that the server maintains a high load. I checked the top of the server and found this.

80a0f810ac345af820b709c9fd0dd6ce.png


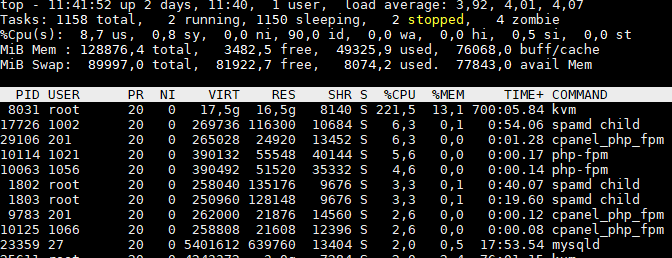
I think it's not normal no? What could be the cause?
 
Lots of idle cpu and no IO wait as well. Thats not high CPU load when 90% of your cpu is idle.

Again, please read what the load is about. Also, it is not about CPU utilization in Linux, it's cpu load in average including sleeping processes. If you've hanging processes in D state, your load will be at least as high as the number of processes in that state, even if you system or more precisely your CPU does not have anything besides 1% utilization
 
Again, please read what the load is about. Also, it is not about CPU utilization in Linux, it's cpu load in average including sleeping processes. If you've hanging processes in D state, your load will be at least as high as the number of processes in that state, even if you system or more precisely your CPU does not have anything besides 1% utilization

I get that, but still had lots of idle CPU with no IO wait, I highly doubt any process was in a D/blocking state. Simply pointing out what he is saying is high load really isn't high load for the hardware he is on.
 
I get that, but still had lots of idle CPU with no IO wait, I highly doubt any process was in a D/blocking state.

The thing is that if you're in D state, that does not mean necessarily that you have I/O wait time in your CPU counters, e.g. on NFS you will not have that. I had a system a few years back with a load of over 100 that had a lot of hanging processes due to a nfs server outage but was fine.

Simply pointing out what he is saying is high load really isn't high load for the hardware he is on.

If you only count the numbers in your partly scapped screenshot and taking into account that a top or htop output is a momentary capture of your system, while the load is a average, the numbers are not that off. Summing up the current cpu utilization in your screenshot yields a value of ca. 250%, which would roughly reflect a load value of 2.5. The higher load averages suggest that the load is going down, so the main process causing the load is already gone or using much less CPU. Doing a post-mortem analysis is now impossible, so the only thing I could say about this load situation is that it makes sense.
 
The thing is that if you're in D state, that does not mean necessarily that you have I/O wait time in your CPU counters, e.g. on NFS you will not have that. I had a system a few years back with a load of over 100 that had a lot of hanging processes due to a nfs server outage but was fine.


If you only count the numbers in your partly scapped screenshot and taking into account that a top or htop output is a momentary capture of your system, while the load is a average, the numbers are not that off. Summing up the current cpu utilization in your screenshot yields a value of ca. 250%, which would roughly reflect a load value of 2.5. The higher load averages suggest that the load is going down, so the main process causing the load is already gone or using much less CPU. Doing a post-mortem analysis is now impossible, so the only thing I could say about this load situation is that it makes sense.

Which is what I am getting at as well. Everything is aok!
 

About

The Proxmox community has been around for many years and offers help and support for Proxmox VE, Proxmox Backup Server, and Proxmox Mail Gateway.
We think our community is one of the best thanks to people like you!

Get your subscription!

The Proxmox team works very hard to make sure you are running the best software and getting stable updates and security enhancements, as well as quick enterprise support. Tens of thousands of happy customers have a Proxmox subscription. Get yours easily in our online shop.

Buy now!